How it works
- Open 02 Setup. Enter the unit name, the leader and the products. Check the eight KPIs, their targets and whether higher or lower is better.
- Fill one row per month in 04 Cost View: good units, sales value and material per unit, operator hours, labor rate, support, energy, scrap and allocated cost.
- Fill one row per month in 03 Monthly KPIs. Cost per unit is taken from the cost view. Green means on target, red means off target.
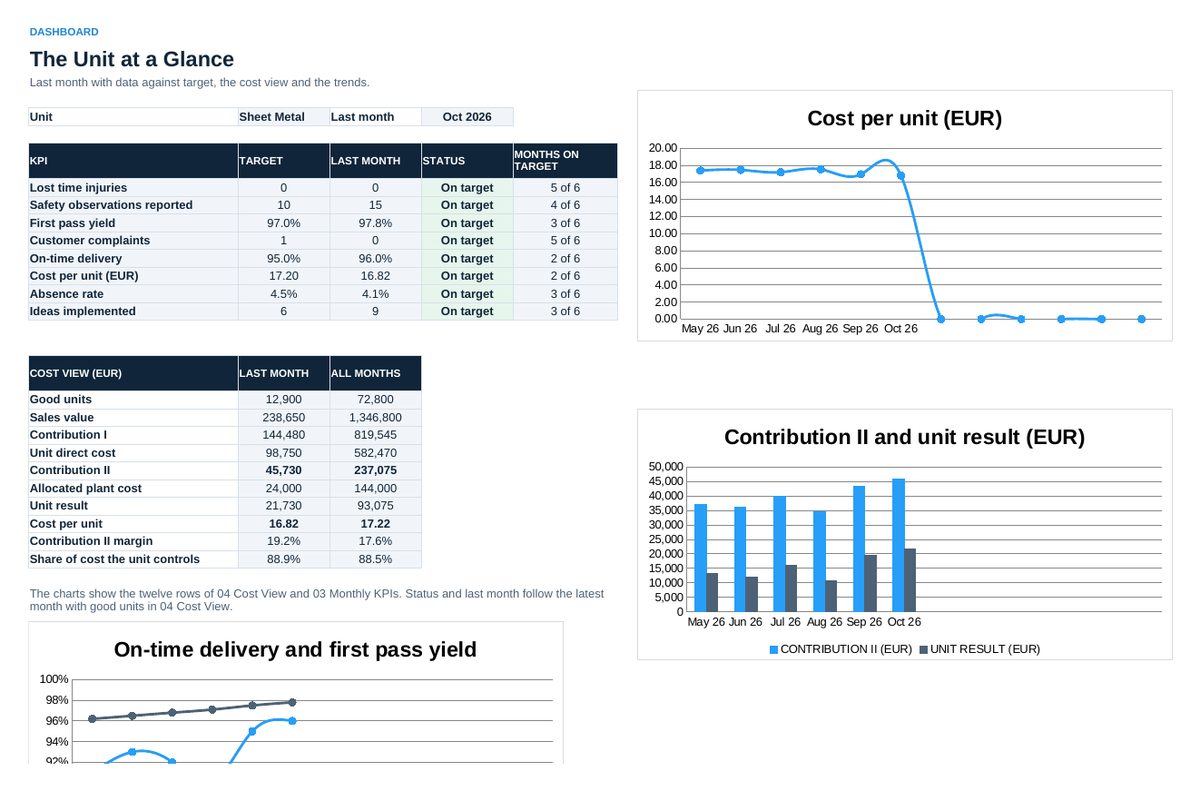
- Open 05 Dashboard before the monthly review: last month against target, the cost view, the trends.
- Agree the actions of the review in 06 Action Plan, with owner and date.
Definitions used in the workbook
- Contribution I: Sales value minus material.
- Contribution II: Contribution I minus unit direct cost: operators, assigned support, energy and consumables, scrap and rework.
- Unit result: Contribution II minus allocated plant cost.
- Cost per unit: Material plus unit direct cost plus allocated cost, divided by good units. Period values are weighted by units, never averaged.
Sheets in the workbook
- Start
- Setup
- Monthly KPIs
- Cost View
- Dashboard
- Action Plan
Who it is for
Unit and value stream managers with their own results responsibility.
The method behind the numbers
This workbook is part of the Factory within Factory toolkits. The Starter Kit adds the guide and the checklist for the first 30 days. The Excellence Bundle adds playbook, workshop pack, templates, deck and the complete Excel system.