How it works
- Open 02 Setup. Enter your electricity and gas prices, the emission factors, production hours, base load target and the status date.
- Enter twelve months of good parts and meter readings in 03 Meters. Energy and CO2e per good part calculate per month and for the year.
- Read the main meter every Sunday afternoon and enter the value in 04 Base Load. The sheet shows what this load costs per year.
- Put every idea on the same card in 05 Measures. EUR, CO2e, payback, cost per metric ton and rank calculate.
- Log every compressed air leak in 06 Leak Tags. Open tags older than 14 days turn red.
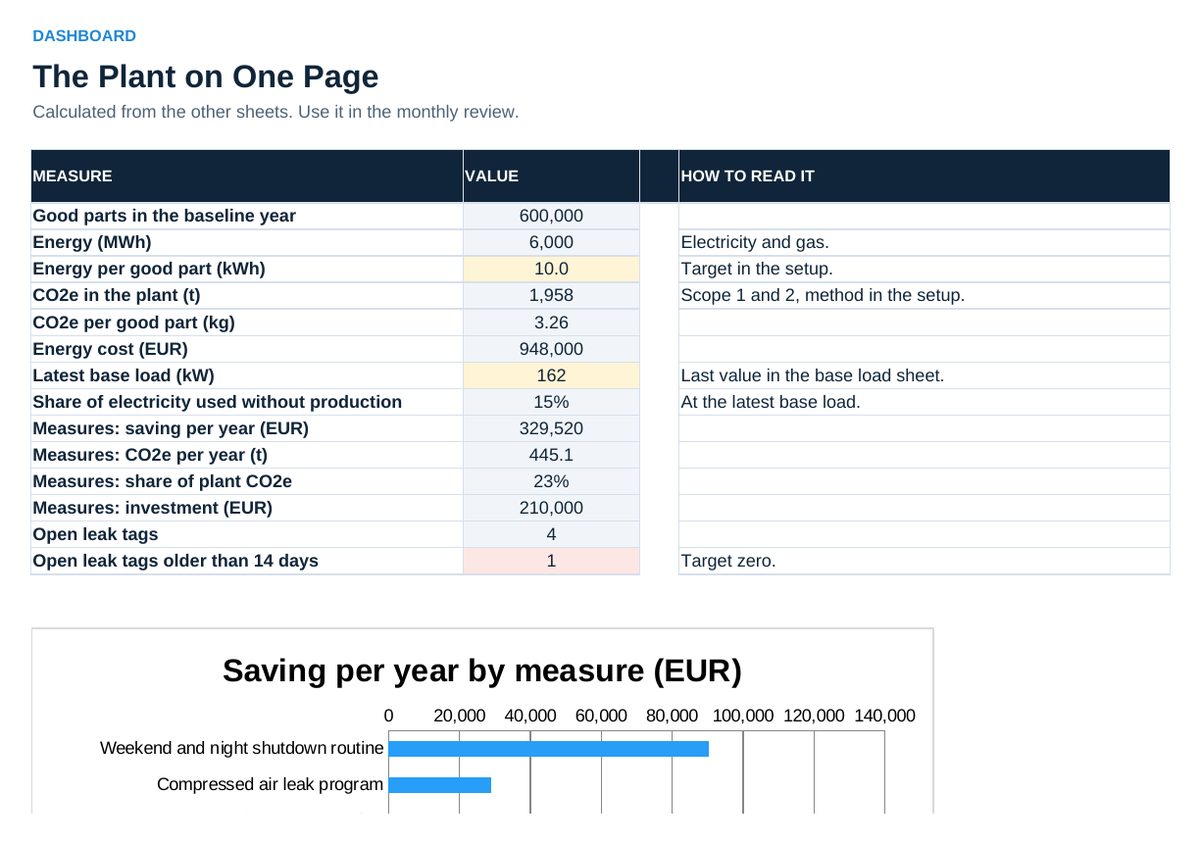
- Review 07 Dashboard every month with the plant manager.
Definitions used in the workbook
- Energy per good part: Electricity plus gas in kWh, divided by good parts. Scrap carries its full energy, so it shows up in this number.
- CO2e: Carbon dioxide equivalent. Electricity times its factor plus gas times its factor. State whether the electricity factor is location based or market based.
- Base load: Power drawn when nothing is produced. Everything above the target is waste.
- Payback: Investment divided by the saving per year.
- Cost per metric ton: Investment spread over its life, minus the saving per year, divided by the metric tons avoided. Negative means the measure saves money.
Sheets in the workbook
- Start
- Setup
- Meters
- Base Load
- Measures
- Leak Tags
- Dashboard
Who it is for
Energy managers, maintenance leads and plant managers.
The method behind the numbers
This workbook is part of the Lean and Green toolkits. The Starter Kit adds the guide and the checklist for the first 30 days. The Excellence Bundle adds playbook, workshop pack, templates, deck and the complete Excel system.