How it works
- Open 06 Lists. Set the working hours per day, the service level and the targets. Adapt the error and query types.
- Map the process in 02 Process Map: one row per step with touch time in minutes and waiting time after the step in working hours. Use the median of twenty real cases.
- Enter every case in 03 Case Log: received, completed, first time right yes or no, and the error type if not.
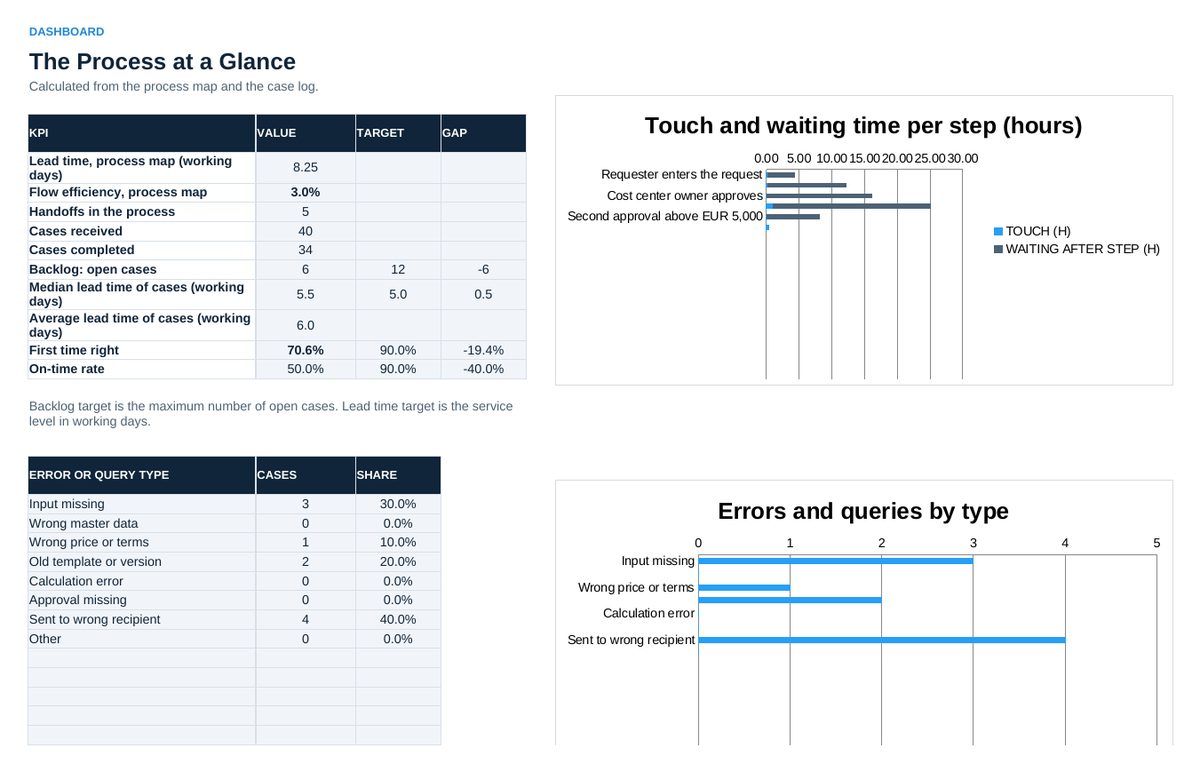
- Read 04 Dashboard in the weekly review: lead time, flow efficiency, first time right, on-time rate, backlog and error types.
- Agree one action per week in 05 Action Plan, with owner and date.
Definitions used in the workbook
- Lead time (map): Touch time plus waiting time of all steps, in working hours.
- Flow efficiency: Touch time divided by lead time.
- Lead time (cases): Working days from received to completed. A case completed on the day it arrived has a lead time of 0.
- First time right: Completed cases without correction, return or query, divided by all completed cases.
- On-time rate: Completed cases with a lead time within the service level, divided by all completed cases.
Sheets in the workbook
- Start
- Process Map
- Case Log
- Dashboard
- Action Plan
- Lists
Who it is for
Team leads in purchasing, order handling, HR or finance who want faster office processes.
The method behind the numbers
This workbook is part of the Lean Administration toolkits. The Starter Kit adds the guide and the checklist for the first 30 days. The Excellence Bundle adds playbook, workshop pack, templates, deck and the complete Excel system.