How it works
- Open 02 Setup. Enter your product families with strategy, hours per unit on the bottleneck, price, unit cost and service level. Enter the first plan month and the budget.
- Enter the agreed demand plan for six months in 03 Demand Plan, in units per family and month.
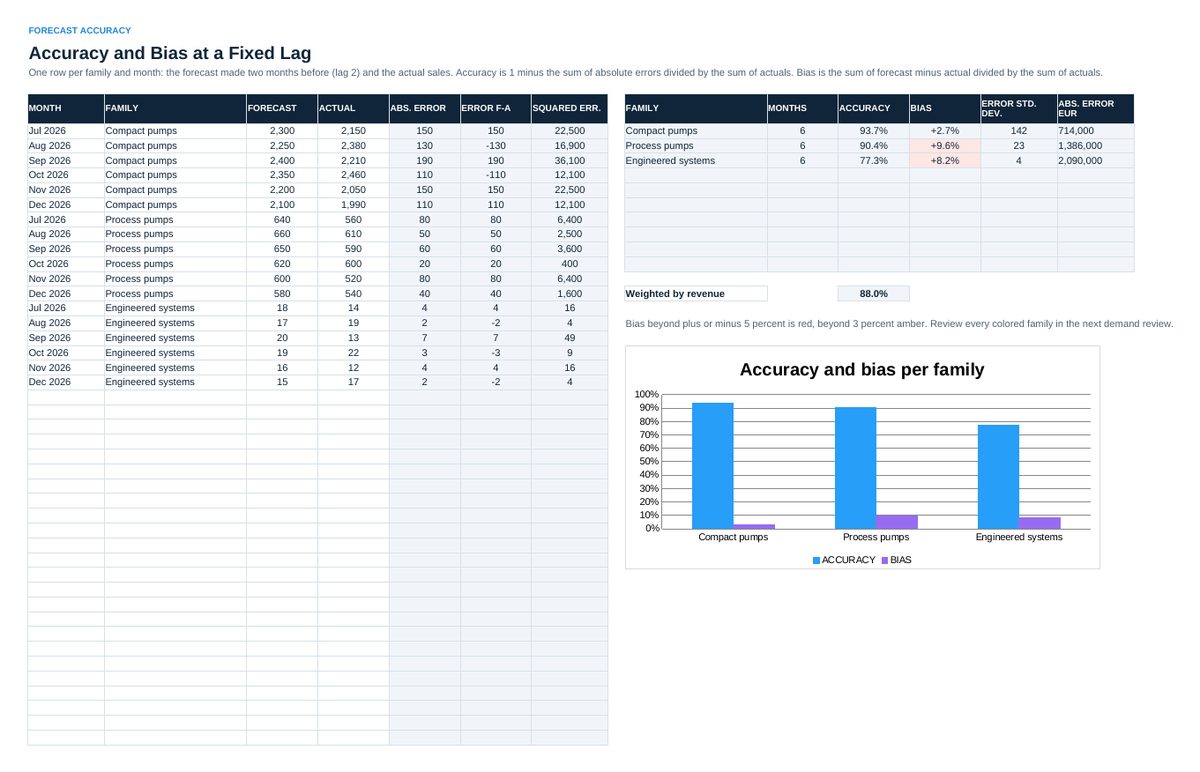
- Enter forecast and actual sales of the last months in 04 Accuracy. Accuracy, bias and error deviation calculate per family.
- Enter the available hours per month in 05 Capacity. Required hours, load and gaps calculate.
- Enter lead time, replenishment quantity and actual stock in 06 Inventory. Targets and excess calculate.
- Read 07 Dashboard in the pre-S&OP and show it in the executive review.
Definitions used in the workbook
- Forecast accuracy: 1 minus the sum of absolute errors divided by the sum of actuals, per family, at lag 2.
- Bias: Sum of forecast minus actual divided by the sum of actuals. Positive means the forecast was too high.
- Load: Required hours divided by available hours on the bottleneck.
- Target stock: Safety stock plus cycle stock. Days = units divided by demand per working day.
Sheets in the workbook
- Start
- Setup
- Demand Plan
- Accuracy
- Capacity
- Inventory
- Dashboard
Who it is for
Supply chain and planning managers who start an S&OP process.
The method behind the numbers
This workbook is part of the Sales and Operations Planning toolkits. The Starter Kit adds the guide and the checklist for the first 30 days. The Excellence Bundle adds playbook, workshop pack, templates, deck and the complete Excel system.