How it works
- 02 Setup: wave, limits and lists. 03 Customers: classes, selection and contacts. 04 Questionnaire: your questions and the time check.
- 05 Responses: one row per answer, all waves in one list. 06 Results: criteria, drivers and the chart of importance and satisfaction.
- 07 Segments: results by class and role with a warning for small groups, and the spread of the ratings. 08 Accounts: every customer with answers, critics and status.
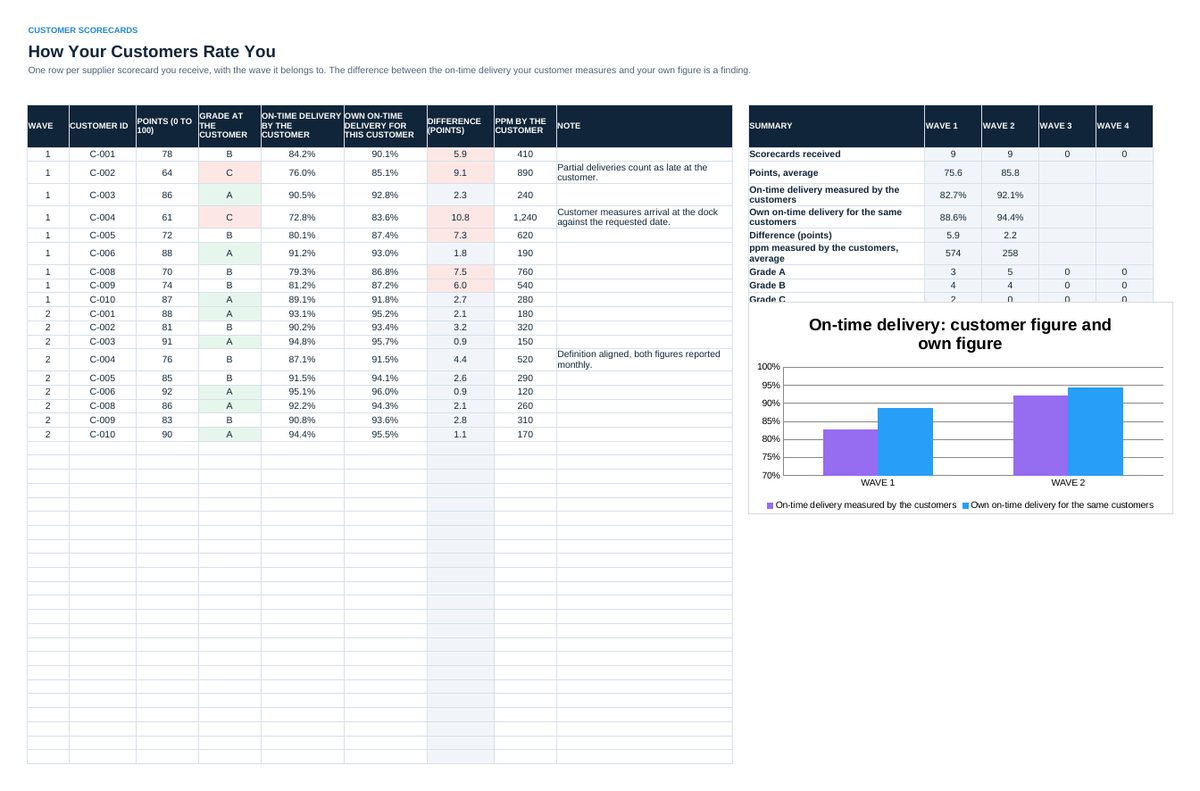
- 09 Hard Data: on-time delivery, complaint rate and first response per month. 10 Scorecards: how your customers rate you in their own supplier evaluation.
- 11 Actions: every action with source, owner, date, status and feedback to the customer.
- 12 Waves: the trend over the waves. 13 Audit once a year. 14 Status for the report to the management.
Definitions used in the workbook
- Recommendation score: Share of answers 9 and 10 (recommenders) minus share of answers 0 to 6 (critics) on the 0 to 10 question, in points from -100 to +100.
- Rough range: About two standard errors of the score. A change between two waves is clear when it is larger than the combined range of both waves.
- Driver: Correlation between the rating of a criterion and overall satisfaction, from -1 to 1. A high value means: who is unhappy here is unhappy overall.
- Account at risk: A customer with at least one critic among its contacts in the wave.
Sheets in the workbook
- Start
- Setup
- Customers
- Questionnaire
- Responses
- Results
- Segments
- Accounts
- Hard Data
- Scorecards
- Actions
- Waves
- Audit
- Status
Who it is for
Managers who run customer satisfaction as a yearly measurement and report it to the management.
The method behind the numbers
This workbook is part of the Customer Satisfaction Measurement toolkits. The Starter Kit adds the guide and the checklist for the first 30 days. The Excellence Bundle adds playbook, workshop pack, templates, deck and the complete Excel system.