How it works
- 02 Setup holds the area data and values. 03 Audit holds the 25 statements of the checklist, scored at three points in time.
- 04 Use Cases ranks all ideas. 05 Data Points and 06 Reason Codes define what is collected and how stops are explained.
- 07 OEE compares machine data with the old paper figures. 08 Losses shows the loss Pareto of the week.
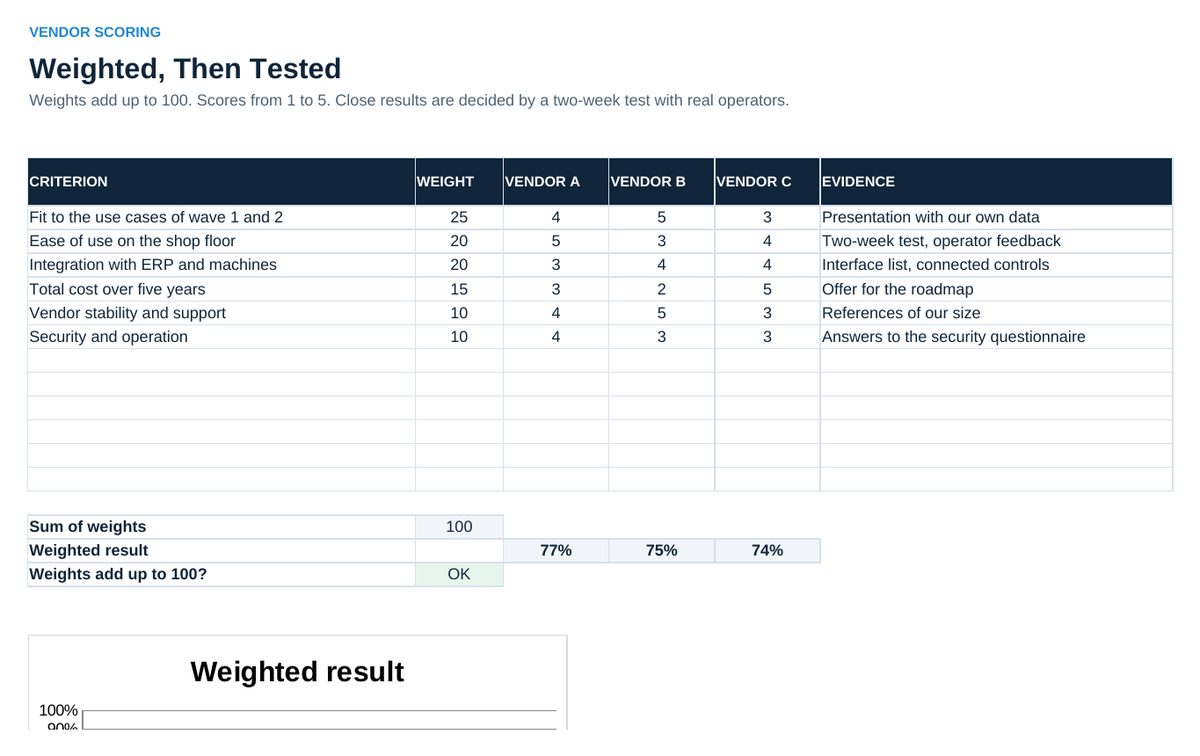
- 09 Vendors scores systems with weighted criteria. 10 Interfaces lists every system and data flow with its owner.
- 11 Security tracks the basic rules per area. 12 Roadmap plans the waves. 13 Business Case calculates benefit and payback.
- 14 Adoption tracks usage and OEE month by month against the targets.
Definitions used in the workbook
- Weighted vendor result: Sum of weight times score, divided by 5 times the sum of weights. Close results are decided by a test on the shop floor.
- Adoption: Share of stops with a reason and share of daily meetings held on the board. Without adoption no benefit.
Sheets in the workbook
- Start
- Setup
- Audit
- Use Cases
- Data Points
- Reason Codes
- OEE
- Losses
- Vendors
- Interfaces
- Security
- Roadmap
- Business Case
- Adoption
Who it is for
Digitalization teams that select systems and roll them out across a plant.
The method behind the numbers
This workbook is part of the Digital Shop Floor toolkits. The Starter Kit adds the guide and the checklist for the first 30 days. The Excellence Bundle adds playbook, workshop pack, templates, deck and the complete Excel system.