How it works
- Open 02 Setup. Enter the characteristic, the specification limits, the yearly volume, the cost of one defect and the target Cpk.
- Write the charter in 03 Charter. Baseline, cost and saving fill in automatically from the capability sheet.
- Enter the data in 04 Data: one row per subgroup of five consecutive parts. Baseline on the left, after improvement on the right.
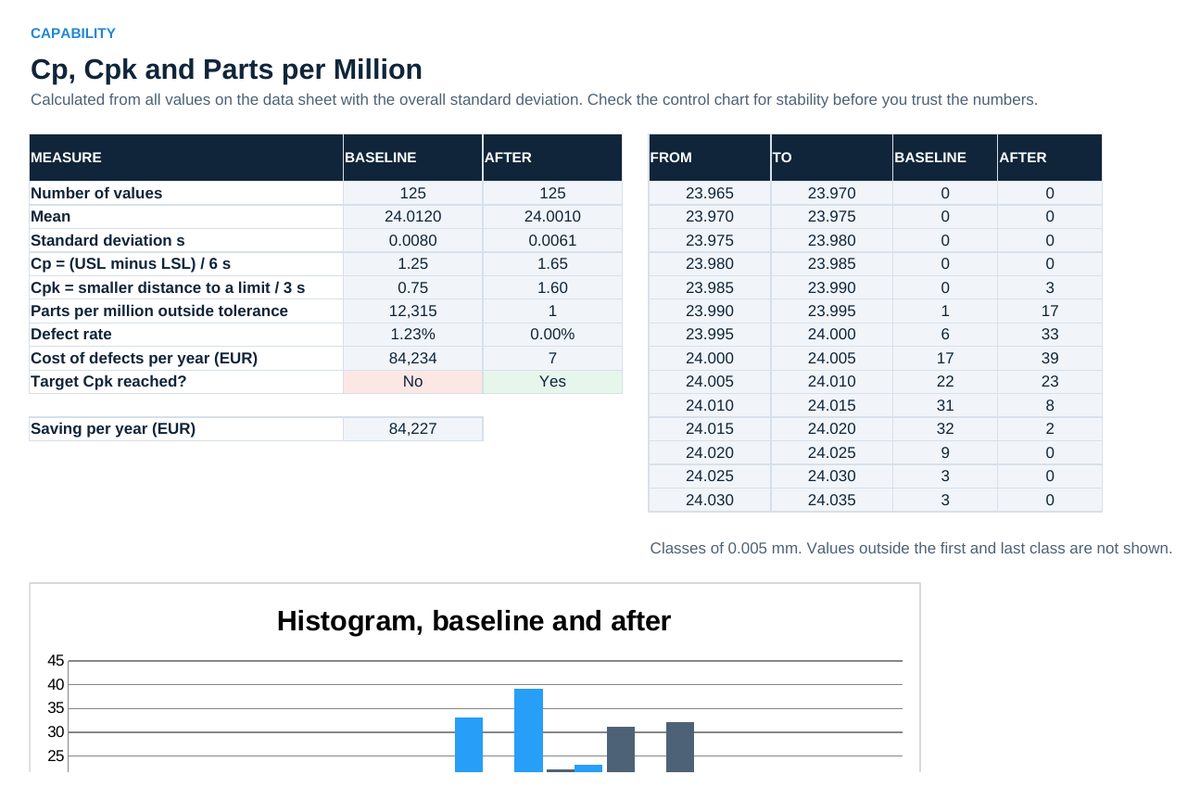
- Read 05 Capability: mean, standard deviation, Cp, Cpk, parts per million, cost per year and a histogram of both data sets.
- Watch 06 Control Chart: X-bar and R chart with limits from the data after improvement. Track tollgates in 07 and actions in 08.
Definitions used in the workbook
- Cp: Tolerance width divided by six standard deviations. Shows whether the spread would fit if the process were centered.
- Cpk: Distance from the mean to the nearer limit divided by three standard deviations. Includes centering. 1.33 is a common minimum.
- Parts per million: Expected share outside the limits from the normal distribution, times one million. Check the histogram for a bell shape.
- Control limits: Calculated from the process, not from the drawing. A point outside means the process changed: stop, look, record.
Sheets in the workbook
- Start
- Setup
- Charter
- Data
- Capability
- Control Chart
- Tollgates
- Actions
Who it is for
Green Belts and quality engineers.
The method behind the numbers
This workbook is part of the Six Sigma toolkits. The Starter Kit adds the guide and the checklist for the first 30 days. The Excellence Bundle adds playbook, workshop pack, templates, deck and the complete Excel system.