How it works
- 02 Setup holds characteristic, limits, volume, cost and lists. 03 Portfolio ranks candidate projects and tracks benefits across the program.
- 04 Charter holds the charter of one project and its tollgates. 05 Gage R&R checks the measurement system before data is collected.
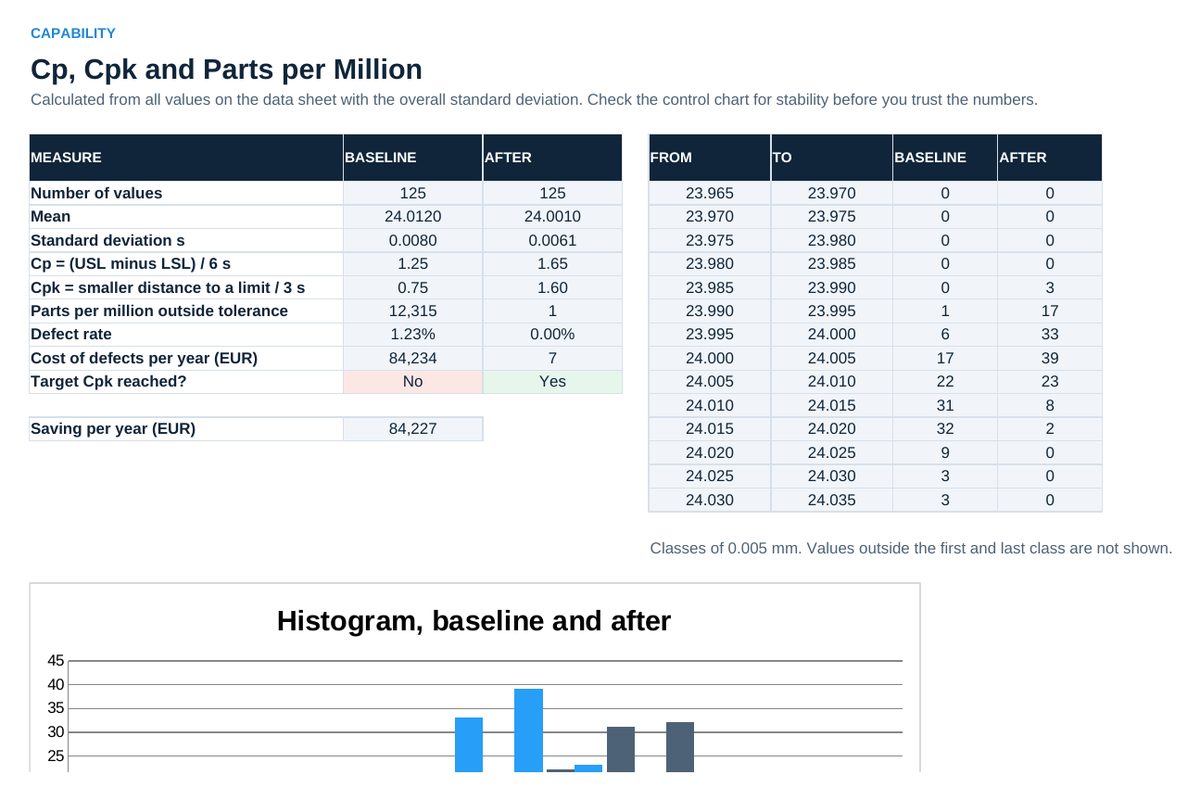
- 06 Data and 07 Capability calculate baseline and improved capability, cost of defects and saving, with a histogram.
- 08 Hypothesis Test compares two groups, 09 Regression quantifies the effect of one input, 10 FMEA ranks failure modes.
- 11 Experiment evaluates a two-level design with three factors. 12 Control Chart and 13 Control Plan hold the gain.
- 14 Audit scores the 25 statements of the checklist at four checks over time.
Definitions used in the workbook
- Gage R&R: Average range method with 10 parts, 3 appraisers and 2 trials. Below 10 percent of the tolerance acceptable, above 30 percent fix the gage.
- p-value: Probability of a difference at least this large if there were no real difference. Below 0.05 the difference is usually treated as real.
- R squared: Share of the variation of the output explained by the input in the sample. Valid only inside the measured range.
- Main effect: Average result at the high level of a factor minus the average at the low level.
Sheets in the workbook
- Start
- Setup
- Portfolio
- Charter
- Gage R&R
- Data
- Capability
- Hypothesis Test
- Regression
- FMEA
- Experiment
- Control Chart
- Control Plan
- Audit
Who it is for
Black Belts and quality teams that run a Six Sigma program.
The method behind the numbers
This workbook is part of the Six Sigma toolkits. The Starter Kit adds the guide and the checklist for the first 30 days. The Excellence Bundle adds playbook, workshop pack, templates, deck and the complete Excel system.