How it works
- Open 06 Lists and adapt the causes and targets to your value stream.
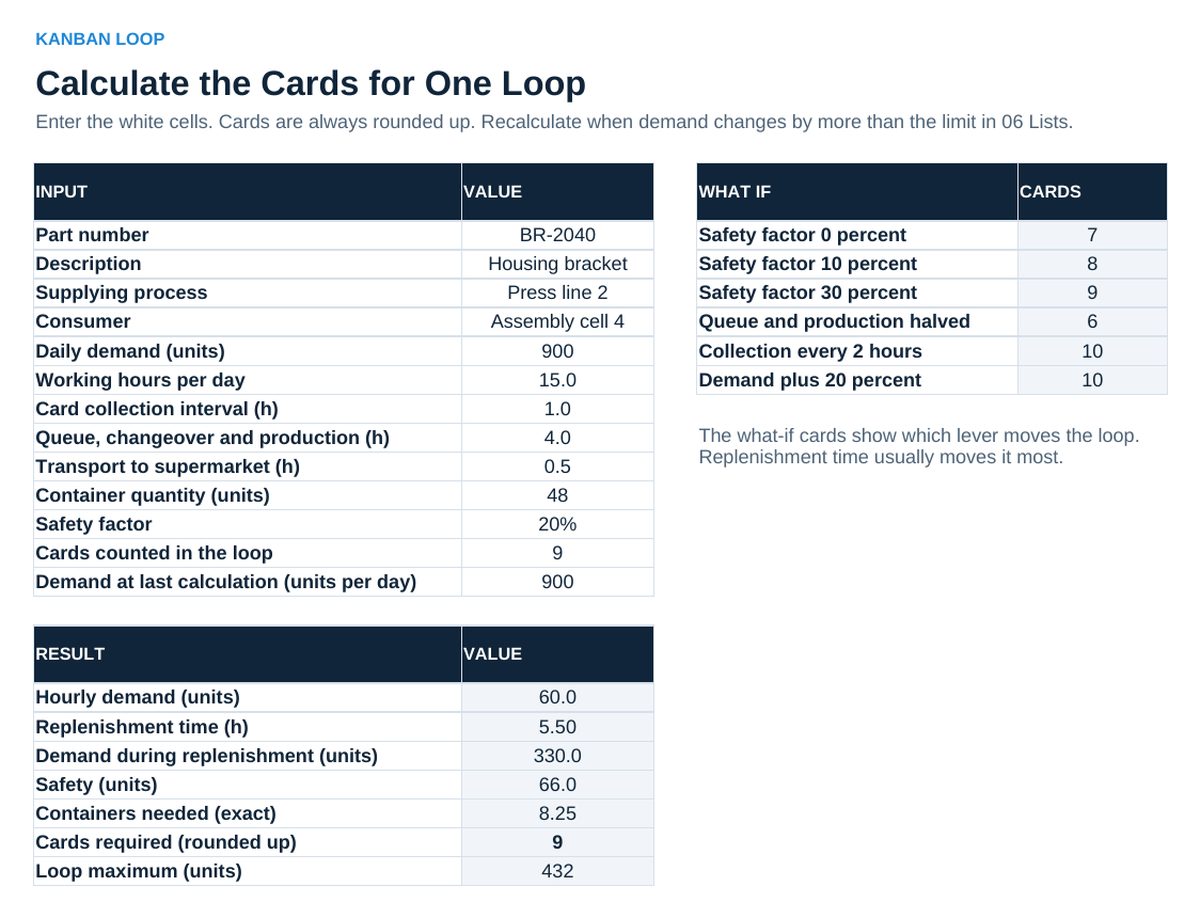
- Enter the loop data in 02 Loop Calculator: demand, hours per day, replenishment times, container quantity, safety factor. The card count calculates.
- Fill one row per working day in 03 Flow Log: order lines due and on time, units completed, demand, WIP counted, finished goods, lost minutes.
- Read 04 Dashboard in the daily review: on-time delivery, lead time, reach, the trend and the largest causes of lost minutes.
- Agree one action at a time in 05 Action Plan, with owner and date.
Definitions used in the workbook
- Cards: Hourly demand times replenishment time times (1 plus safety factor), divided by container quantity, always rounded up.
- Lead time: Time from order release to shipment in working days, estimated as WIP divided by units completed per day (Little’s law).
- On-time delivery: Order lines delivered complete and on or before the confirmed date, divided by order lines due.
- Reach: Inventory reach: stock on hand divided by average daily demand, in working days. Here for finished goods.
- Period values: Calculated from sums, never as an average of daily percentages.
Sheets in the workbook
- Start
- Loop Calculator
- Flow Log
- Dashboard
- Action Plan
- Lists
Who it is for
Logistics planners and production supervisors who introduce or tune Kanban loops.
The method behind the numbers
This workbook is part of the Flow and Just in Time toolkits. The Starter Kit adds the guide and the checklist for the first 30 days. The Excellence Bundle adds playbook, workshop pack, templates, deck and the complete Excel system.