How it works
- Open 02 Setup. Enter the plant or area, the period of the first column and the number of slots the top level list may hold.
- Fill 03 Catalog: one row per figure with purpose, formula, unit, source, method, rhythm and owner. The row turns green when the definition is complete.
- In 04 Targets, enter baseline, target, tolerance and last year. The reaction limit calculates from target and tolerance.
- Enter the value of every figure once per period in 05 Monthly. Latest, target, limit and status calculate.
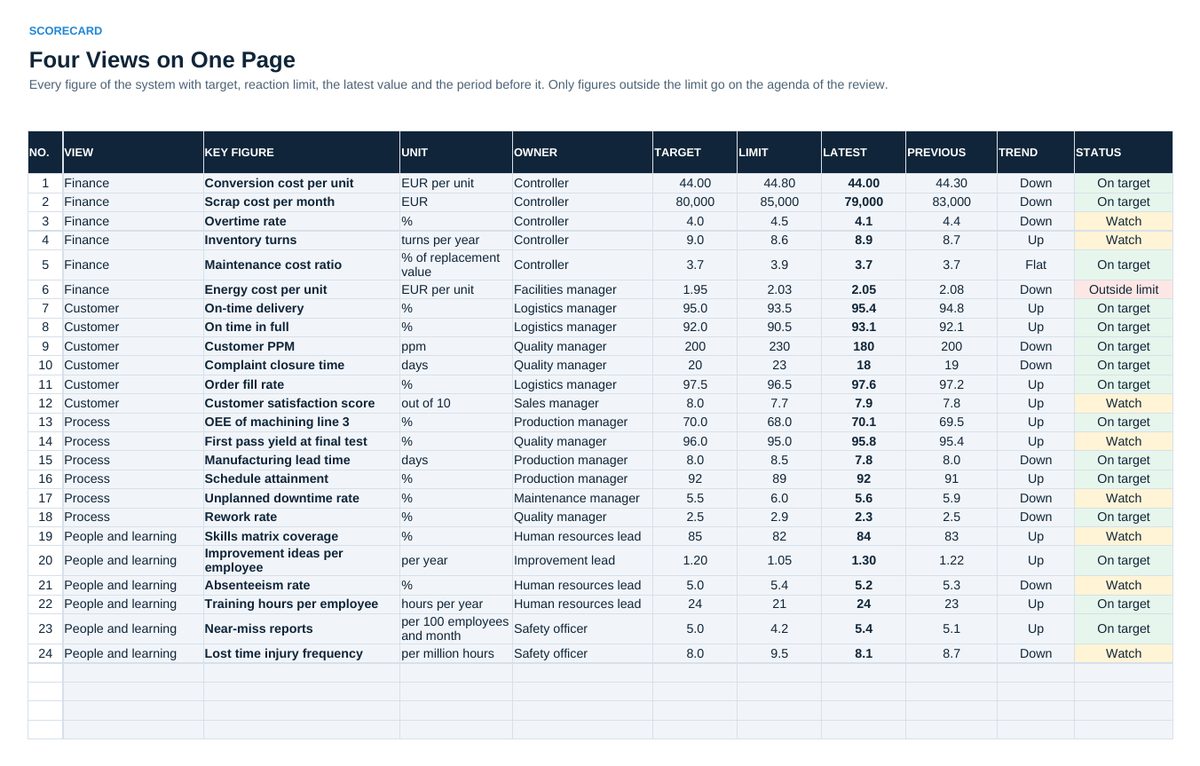
- Read 06 Scorecard in the review: four views, three to five figures outside the limit, one action each. 07 Status is the page about the system itself.
Definitions used in the workbook
- Reaction limit: Target minus tolerance when high is better, target plus tolerance when low is better. Above or below it, an explanation is due.
- Status: On target, Watch (inside the tolerance band) or Outside limit. Only the last group goes on the agenda.
- Definition sheet: The row in 03 Catalog: purpose, formula, unit, direction, source, method, rhythm, owner and known error sources.
- Slots: The agreed size of the top level list. A new figure enters only when a named figure leaves.
Sheets in the workbook
- Start
- Setup
- Catalog
- Targets
- Monthly
- Scorecard
- Status
Who it is for
Plant and area managers who want a short list of figures that steer instead of a long report.
The method behind the numbers
This workbook is part of the KPI Systems and Balanced Scorecard toolkits. The Starter Kit adds the guide and the checklist for the first 30 days. The Excellence Bundle adds playbook, workshop pack, templates, deck and the complete Excel system.