How it works
- 02 Setup holds area, capacity, status date, replacement asset value, budget and operating hours. 03 Assets ranks every asset A, B or C.
- 04 Strategies holds the strategy per failure mode of the A assets and calculates the yearly hours of the tasks.
- 05 Work Orders and 06 Schedule run the weekly rhythm: ready backlog, scheduled hours, compliance, planned share.
- 07 PM Plan shows due and overdue tasks and the monthly PM compliance. 08 Spare Parts calculates reorder points and flags slow movers.
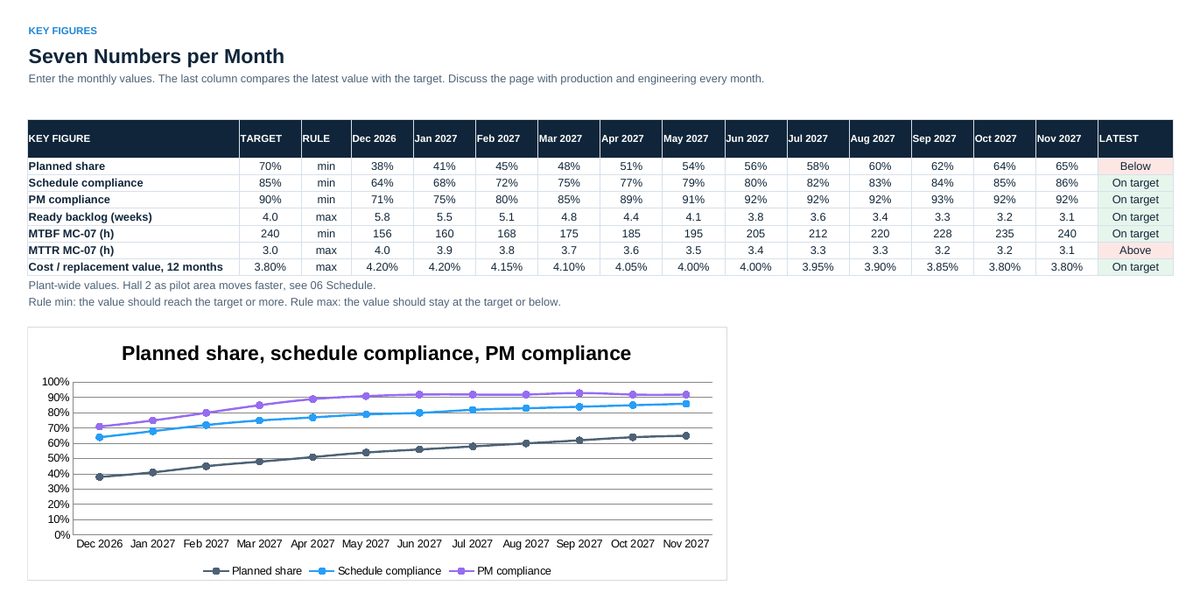
- 09 Bad Actors ranks downtime per asset as a Pareto. 10 Key Figures tracks seven figures per month against targets.
- 11 Budget compares plan and actual by category. 12 Skills shows coverage per task. 13 Audit holds the 25 statements. 14 Status is the one-page summary.
Definitions used in the workbook
- Reorder point: Usage per year x lead time in weeks / 52, rounded up, plus safety stock.
- PM compliance: Preventive tasks done on time divided by tasks due in the month.
- Cost per replacement asset value: Maintenance cost of the last 12 months divided by the replacement value of all assets.
Sheets in the workbook
- Start
- Setup
- Assets
- Strategies
- Work Orders
- Schedule
- PM Plan
- Spare Parts
- Bad Actors
- Key Figures
- Budget
- Skills
- Audit
- Status
Who it is for
Maintenance organizations that steer several areas or plants.
The method behind the numbers
This workbook is part of the Maintenance Management toolkits. The Starter Kit adds the guide and the checklist for the first 30 days. The Excellence Bundle adds playbook, workshop pack, templates, deck and the complete Excel system.