How it works
- Open 07 Lists and adapt the stop reasons to your machine. Twelve reasons at most.
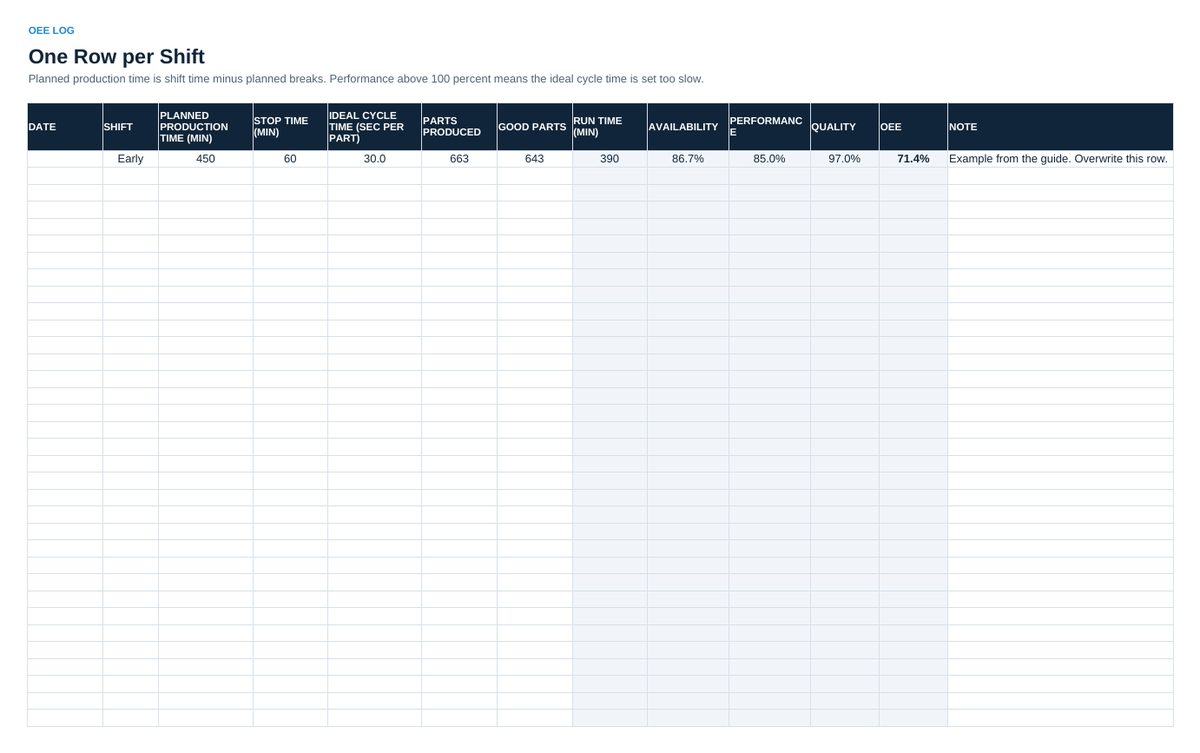
- Fill one row in 02 OEE Log per shift: planned production time, stop time, ideal cycle time, parts produced, good parts.
- Enter every stop longer than five minutes in 03 Stop Log, with the reason, at the time it happens.
- Read 04 Dashboard in the weekly review: OEE for the period, the trend and the largest stop reason.
- Log every tag from the initial cleaning in 05 Tag Log. Review by age.
- Agree one action per week in 06 Action Plan, with owner and date.
Definitions used in the workbook
- Availability: Run time divided by planned production time.
- Performance: Parts produced times ideal cycle time, divided by run time.
- Quality: Good parts divided by parts produced.
Sheets in the workbook
- Start
- OEE Log
- Stop Log
- Dashboard
- Tag Log
- Action Plan
- Lists
Who it is for
Maintenance leads, line leaders and TPM coordinators.
The method behind the numbers
This workbook is part of the TPM toolkits. The Starter Kit adds the guide and the checklist for the first 30 days. The Excellence Bundle adds playbook, workshop pack, templates, deck and the complete Excel system.