How it works
- 02 Cost Map: plant cost of last year by cost type and cost center, with owners.
- 03 Rates and 04 Machine Rates: rates of the bottleneck in detail and of all main machines with the same rules. 05 Labor Rates per role.
- 06 Part Cost: cost per part, margin and break-even with a scenario column. 07 Products: top products ranked by total contribution. 08 Break-Even: the chart.
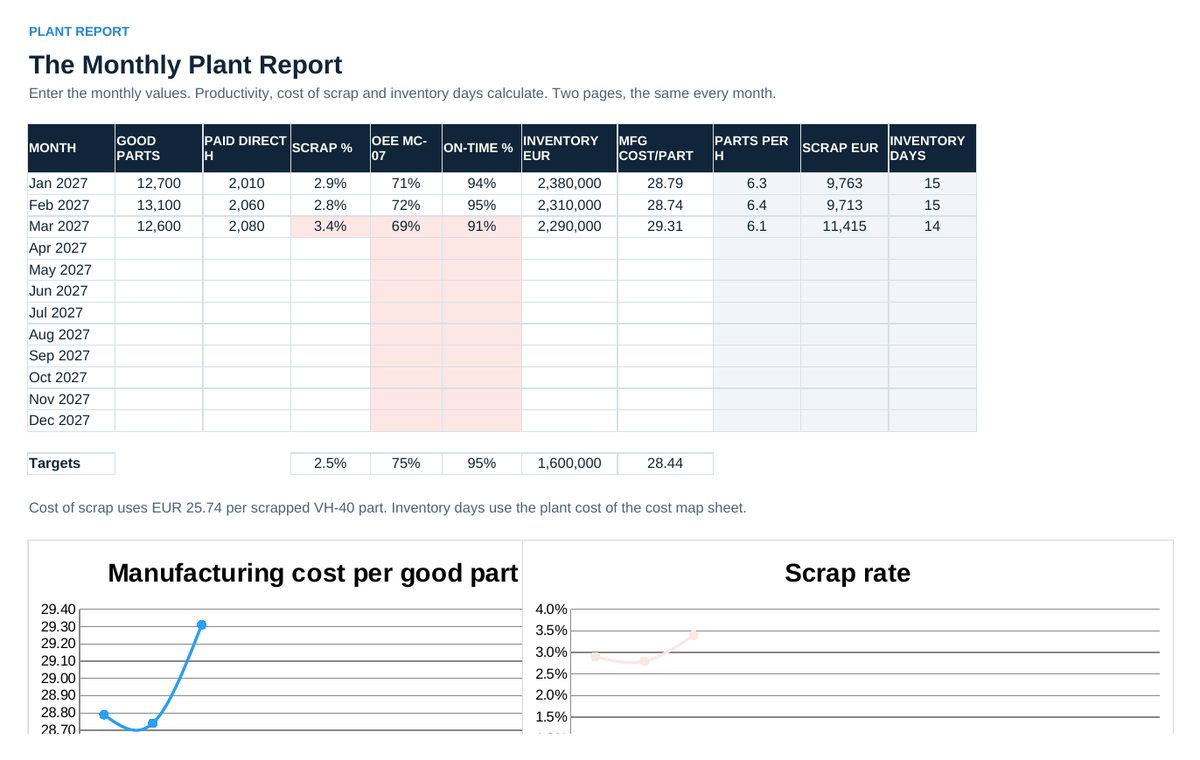
- Every month: 09 Budget, 10 Variances by cause, 15 Actions. 13 Plant Report with the KPIs of the month.
- 11 Lean in Euros and 12 Business Case for every improvement above your limit. 14 Audit every six months.
Definitions used in the workbook
- Flexed budget: Variable costs at actual output, fixed costs at plan.
- Variances: Price, quantity, efficiency, rate and volume. Positive values are unfavorable.
- Cash or capacity: Only effects that change payments are cash. Freed hours are capacity until someone uses them.
- Net present value: Discounted annual effects minus the investment. Above zero, the improvement earns more than the discount rate.
Sheets in the workbook
- Start
- Cost Map
- Rates
- Machine Rates
- Labor Rates
- Part Cost
- Products
- Break-Even
- Budget
- Variances
- Lean in Euros
- Business Case
- Plant Report
- Audit
- Actions
Who it is for
Plant controllers and operations managers who run the monthly plant report.
The method behind the numbers
This workbook is part of the Cost and Controlling toolkits. The Starter Kit adds the guide and the checklist for the first 30 days. The Excellence Bundle adds playbook, workshop pack, templates, deck and the complete Excel system.