How it works
- 02 Setup holds work centers, losses, families, routings and parameters: start date, status date, work in progress limit, target utilization.
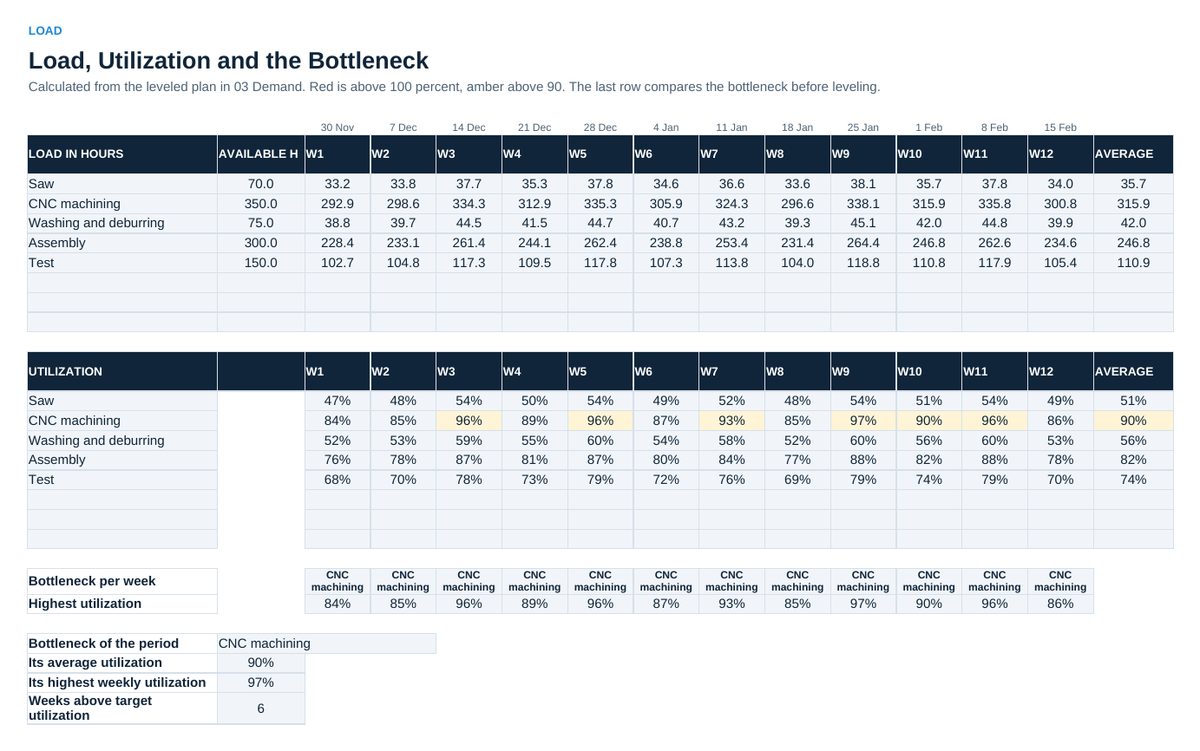
- 03 Demand holds twelve weeks of ordered quantities. Enter leveling moves as plus and minus quantities. 04 Load calculates load, utilization and the bottleneck from the leveled plan.
- 05 Buffer tracks orders in front of the bottleneck with drum, buffer and rope: buffer used and zone per order, with the cause of red orders.
- 06 Lot Size compares the economic lot size with the setup budget of the bottleneck. 07 Sequence compares priority rules for any queue.
- 08 Release checks orders against material, tools, program, documents and slot, and against the work in progress limit. 09 Lead Time applies Little’s Law.
- 10 Delivery measures on-time delivery and adherence, 11 Disruptions logs lost time with a Pareto of causes. 12 Status shows the plant on one page, 13 Audit holds the 25 statements, 14 Actions the decisions.
Definitions used in the workbook
- Buffer used: Time since release divided by the planned buffer time. Up to one third green, up to two thirds yellow, above red.
- Economic lot size: Square root of 2 x annual demand x cost per setup divided by holding cost per unit and year.
- Setup budget: Free hours of the bottleneck below the target utilization, divided by the setup time: how many extra setups the bottleneck can afford.
Sheets in the workbook
- Start
- Setup
- Demand
- Load
- Buffer
- Lot Size
- Sequence
- Release
- Lead Time
- Delivery
- Disruptions
- Status
- Audit
- Actions
Who it is for
Planning and production managers who want stable dates and short lead times.
The method behind the numbers
This workbook is part of the Production Planning and Control toolkits. The Starter Kit adds the guide and the checklist for the first 30 days. The Excellence Bundle adds playbook, workshop pack, templates, deck and the complete Excel system.