How it works
- Open 02 Setup. Enter project name, start date (a Monday), status date, budget and contingency.
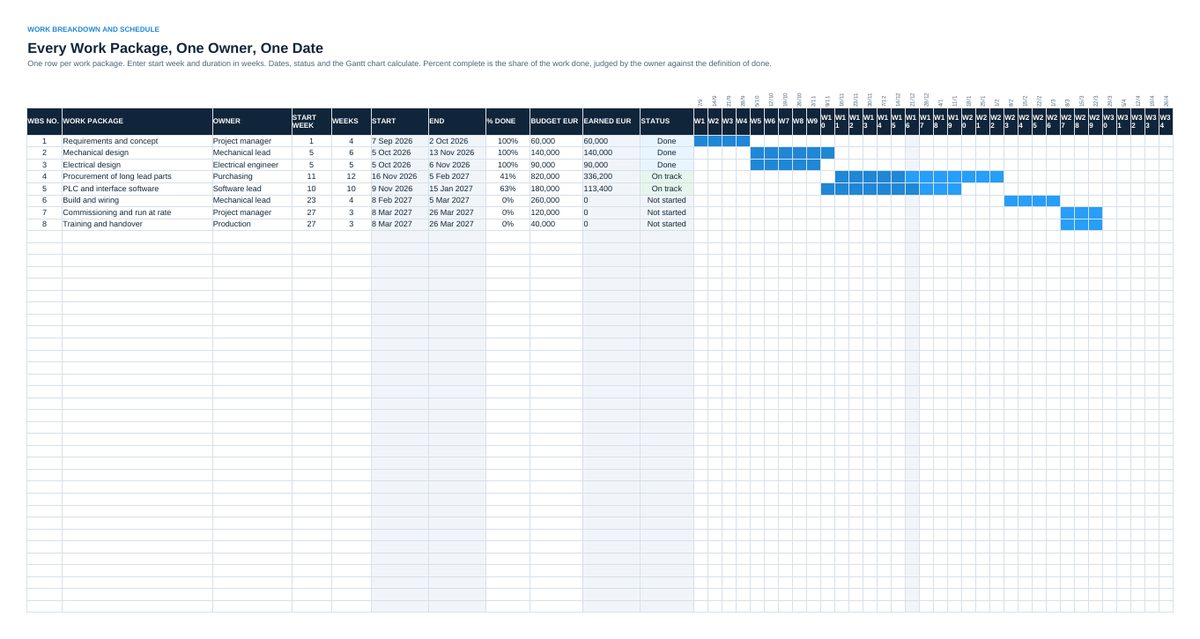
- Build the work breakdown in 03 Schedule: one row per work package with owner, start week, duration, budget. The Gantt chart draws itself.
- Assign roles in 04 RACI. Every row needs exactly one A and at least one R. The check column shows gaps.
- Enter risks in 05 Risks. Score and rank calculate. Review the top five every week.
- Every week: update percent done per work package, set the status date, read 06 Status, record decisions in 07 Decisions.
Definitions used in the workbook
- Status of a work package: Done at 100 percent. Late when the end date has passed. Not started before the start date. Behind when the percent done is more than 5 points below the share of time used. Otherwise on track.
- Earned value: Budget of a work package times its percent done. The sum shows how much of the planned work is really done.
- Overall color: Red when any work package is late. Amber when one is behind or a risk has a score of 12 or more. Otherwise green.
Sheets in the workbook
- Start
- Setup
- Schedule
- RACI
- Risks
- Status
- Decisions
Who it is for
Project managers of mid-size projects in industry.
The method behind the numbers
This workbook is part of the Project Management toolkits. The Starter Kit adds the guide and the checklist for the first 30 days. The Excellence Bundle adds playbook, workshop pack, templates, deck and the complete Excel system.