How it works
- 02 Setup: process, defect types and cost. 03 Check Sheet: one row per day with period, units inspected and defects per type.
- 04 Pareto and 05 Stratification: which defects first, and where they sit.
- 06 Flowchart: the real steps with loops, and where each defect is created and found.
- 07 Histogram: measured values in classes, for all values and for up to three groups, against the specification limits.
- 08 Cause and Effect: possible causes with checks and results. 09 Scatter: pairs of two variables with line and correlation.
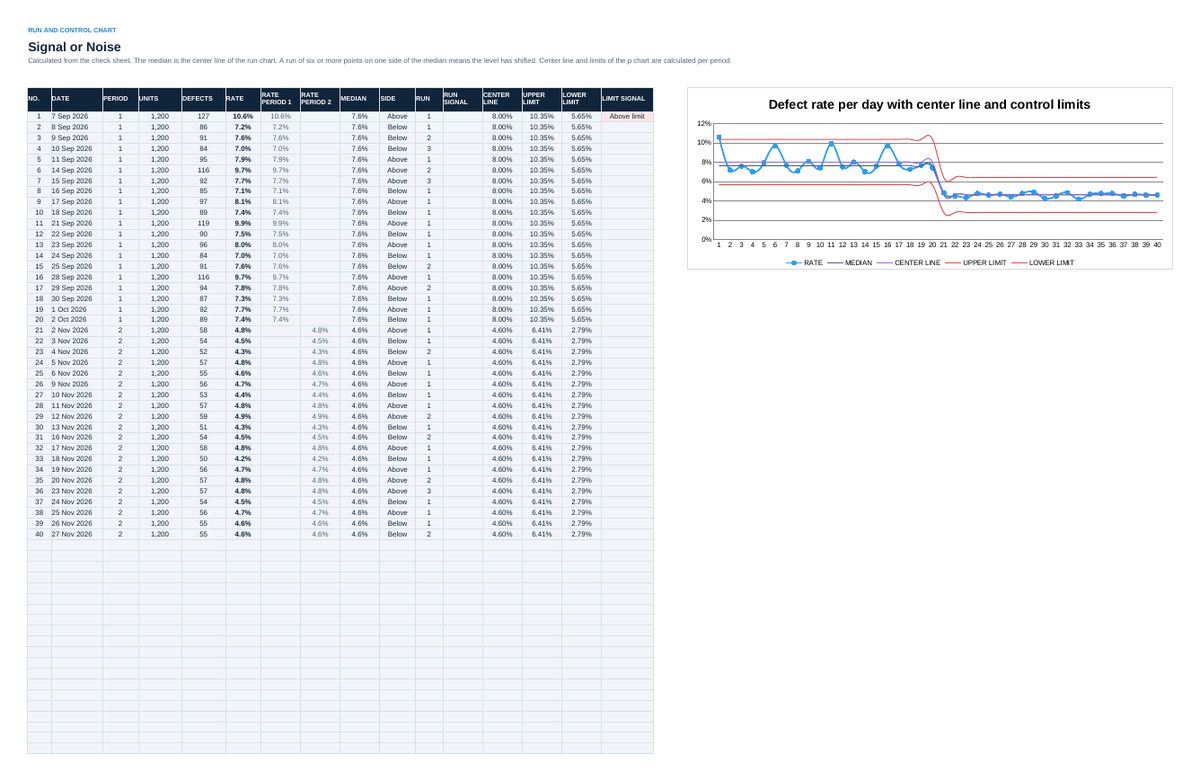
- 10 Run and Control Chart: the defect rate per day with median, center line and limits per period.
- 11 Prioritization: options against weighted criteria. 12 Before and After: the effect per defect type and per year.
- 13 Audit every three months. 14 Status once a month.
Definitions used in the workbook
- Defect rate: Units with a defect divided by units inspected. First pass yield is 1 minus the defect rate.
- Pareto chart: Defect types sorted from largest to smallest, with the cumulative share as a line.
- Stratification: The same data sorted by a factor such as shift, position, product or weekday. Compare the rates of the groups.
- Run chart: One point per day in time order with the median as center line.
- Histogram: Number of measured values per class. Shows center, spread and shape against the specification limits.
- Correlation: The coefficient r lies between -1 and 1. Above 0.7 or below -0.7 the relationship is strong. It does not prove a cause.
Sheets in the workbook
- Start
- Setup
- Check Sheet
- Pareto
- Stratification
- Flowchart
- Histogram
- Cause and Effect
- Scatter
- Run and Control Chart
- Prioritization
- Before and After
- Audit
- Status
Who it is for
Quality and production teams that work through a recurring problem with every basic tool on their own data.
The method behind the numbers
This workbook is part of the Quality Tools toolkits. The Starter Kit adds the guide and the checklist for the first 30 days. The Excellence Bundle adds playbook, workshop pack, templates, deck and the complete Excel system.