How it works
- Open 02 Setup. Enter the project name, the status date and the two limits in days for amber and red.
- List up to 10 milestones in 03 Milestones with owner and baseline date. A milestone is an event with a clear yes or no, not a phase.
- At every status report enter the report date in row 7 and ask each owner for the date planned today. Enter it in the column of that report, also when nothing changed.
- When a milestone is reached, enter the real date in the column REACHED ON and stop entering forecasts for it.
- Read 04 Analysis: slip against the baseline in days, change since the last report, trend and traffic light per milestone.
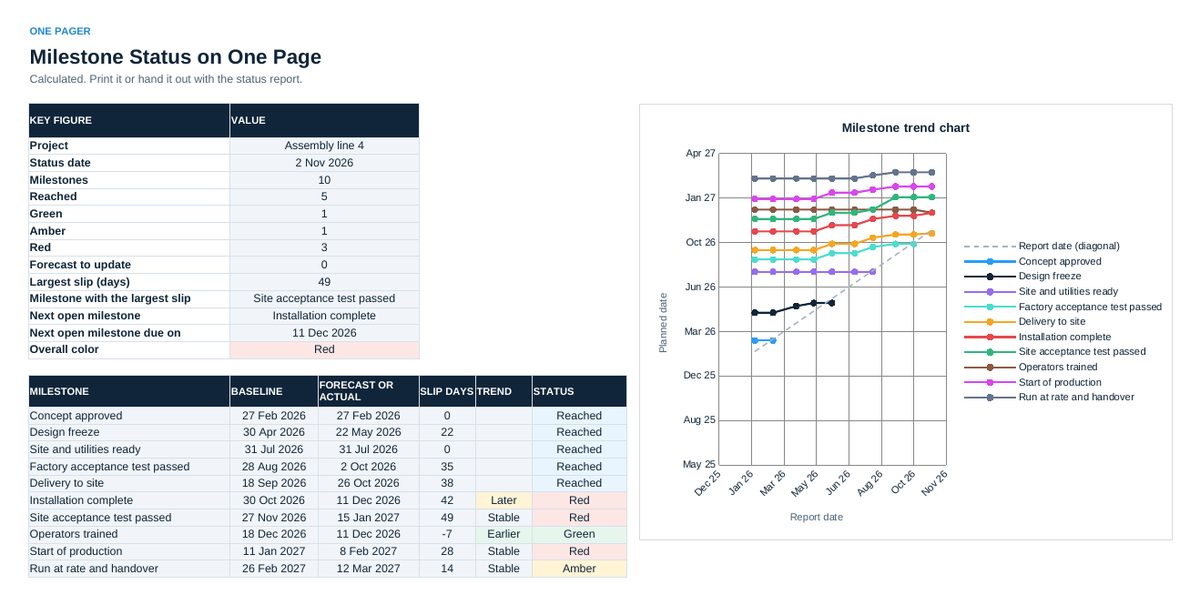
- Show 05 Chart in the status meeting. For every line that moved up, record reason and countermeasure in 07 Slip Log. Hand out 06 One Pager.
Definitions used in the workbook
- Reading the chart: One line per milestone. A flat line means the date holds. A line that climbs means the date moves later, a line that falls means earlier. A milestone is reached where its line meets the diagonal.
- Slip in days: Forecast or real date minus baseline date, in calendar days. A positive number is late.
- Traffic light: Green up to the amber limit, amber above it, red above the red limit. Reached milestones show Reached. Update forecast means the planned date is in the past and the milestone is not marked as reached.
- Trend: Later, Stable or Earlier: the last forecast compared with the forecast of the report before.
Sheets in the workbook
- Start
- Setup
- Milestones
- Analysis
- Chart
- One Pager
- Slip Log
Who it is for
Project managers who report on schedule to a steering committee or a customer.
Cheaper in the pack
This workbook is part of the Project and Cost Tool Pack (EUR 129), which holds all 20 Excel tools of this topic area, and of the Excel Tools Complete Library with all 100 tools.