How it works
- 02 Setup holds the site data and the three scales. Agree them in writing with plant management before the first rating.
- 03 Register holds every risk with cause, event, effect, owner, rating, measure, residual risk and review dates. 04 Matrix shows where they sit.
- 05 Measures compares cost against the expected loss removed. 06 Top Risks is the picture for the management report.
- 07 Supplier Risk scores every supplier on five criteria and marks the critical ones. 08 Continuity Plans holds one row per scenario with a target restart time.
- 09 Exercises records every table top and live exercise with the time achieved. 10 Events checks whether the events of the year were in the register.
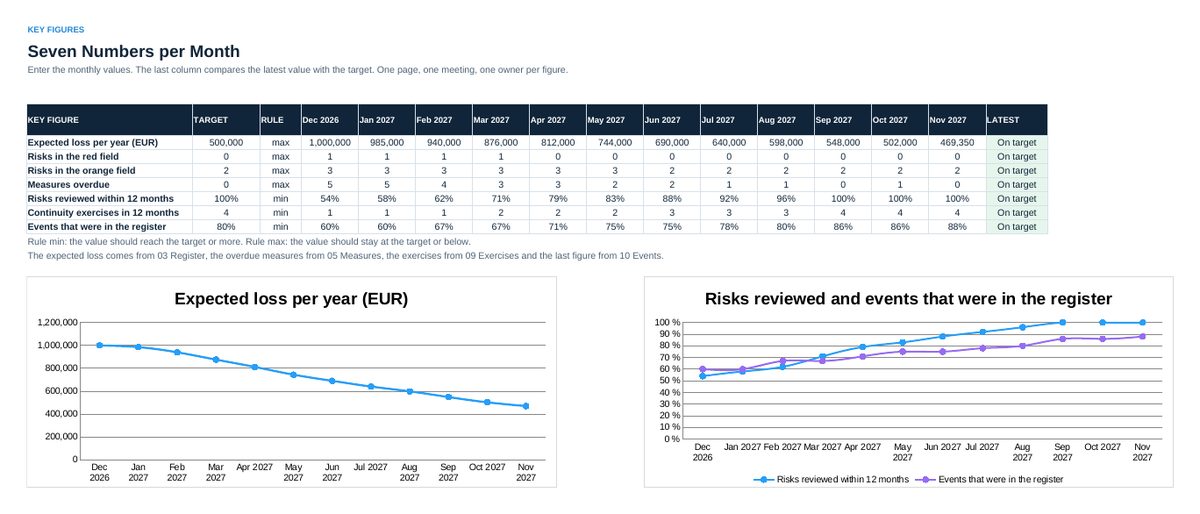
- 11 Project Risk takes the risks of projects and changes at the decision. 12 Key Figures tracks seven numbers per month, 13 Audit the 25 statements, 14 Status is the one-page summary.
Definitions used in the workbook
- Risk: A cause, an event and an effect, with one named owner. Without all three it is a concern, not a risk.
- Score: Probability class times impact class, from 1 to 25. The score decides what has to happen.
- Expected value: Probability per year times impact in EUR. The only field that can be summed, so it gives the order of work.
- Target restart time: When deliveries to the customer run again after a scenario, agreed with sales and proven in an exercise.
Sheets in the workbook
- Start
- Setup
- Register
- Matrix
- Measures
- Top Risks
- Supplier Risk
- Continuity Plans
- Exercises
- Events
- Project Risk
- Key Figures
- Audit
- Status
Who it is for
Risk owners, plant managers and operations leads who run risk work for a whole site and report it twice a year.
The method behind the numbers
This workbook is part of the Operational Risk Management toolkits. The Starter Kit adds the guide and the checklist for the first 30 days. The Excellence Bundle adds playbook, workshop pack, templates, deck and the complete Excel system.