Ishikawa (Fishbone Diagram)
If you are running problem-solving you will come across the so called ISHIKA (or Fishbone) diagram. An ISHIKAWA is a chart that resembles a fish skeleton, with a spine and bones drawn slanting off the spine; used for quality control in two main ways:
As a cause-and-effect diagram, where the spine leads to an effect (head of the fish) and the “bones” are cause factors
As a subdivision of quality requirements, where the spine represents a quality objective and the bones describe subsidiary traits or measurements that are important but are not the end in themselves. (Sometimes referred to as a Reverse Fishbone)
The fishbone diagram is simple to use and allows a quick and effective root cause analysis and to understand what corrective actions can be taken to have fast success. It is used for brainstorming and often in conjunction with the 5 Why Methodology.
In a ISHIKAWA, the various causes are grouped into categories and the causes cascade from the main categories, flowing towards the effect, forming what resembles a fishbone appearance.
The first step is to brainstorm all possibilities that could cause the problem and then drill it down to the factors that are causing the effect. Once found it is the task to eliminate them. It enables the team to focus on why the problem occurs and not the history of symptoms of the problem. It also displays a real time snap shot of the collected inputs of a team as it is updated.
How to Conduct a Fishbone Diagram
Draw the box on the right of a flip chart, large brown paper or white board, and write the problem statement (effect) in the box. Be as clear and specific as you can about the problem.
Now draw the line going from left to right as the ‘spine’, connecting to the problem statement.
Draw the ‘fishbones’ emanating from the spine. These represent the main cause categories.
Now label each Fishbone category. There are two options here. You can use the generic cause categories of Environment, Machine, Man, Material Methodology, which is easier to use for a team that is relatively new to this method but, but you can also use the brainstorming in the group to define the major categories related to the specific problem.
Now brainstorm all the causes to the problem. You could use the approach of writing each cause on a sticky note, going around the group asking each person for one cause. Continue going through the rounds, getting more causes, until all ideas are on the board.
For each cause, agree in the group which category the issue should fall in. (An issue can be addressed in several categories) and continue this process until the group have run out of ideas and all potential causes are at least placed under one category.
Next, get each team member a marker or sticker dots to mark the top three causes they think have the highest effect on the issue.
Not always mentioned but for us very important – also differentiate between the factors in three sectors
Factor of non conformity (process, drawing, etc.)
Factor for non detection
Simple cause
Once completed, the facilitator adds up all the markings for each cause and selects the top three with the highest scores. These three issues will now form the basis of additional investigation in order to find the root cause. The team may then investigate these causes further and use problem-solving techniques like 5 Whys to eliminate their occurrences.
An example Fishbone Diagram
A typical use case in industry is that a production facility has a too high scrap rate. Manager comes in and says “solve it”. As mentioned above the cross functional team gathered all data and ideas during a brainstorming session and listed all possible causes into the main categories.
The next step would be to pick the top three causes and delve deeper to find the true root causes.
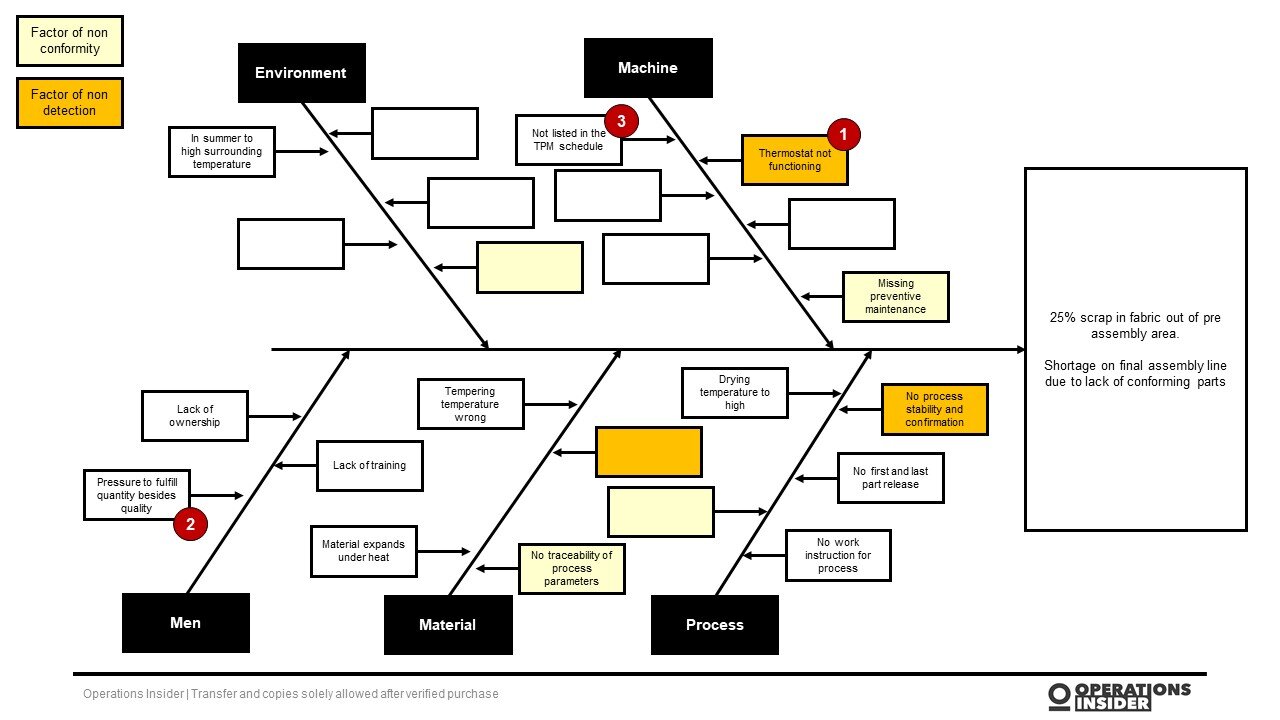
Example of an Ishikawa Diagram
Some hints:
Remember, as with any task-based activity, always close a problem solving session with actions, clearly assigned owners and due dates – “Who is doing what by when?” This is important, as it keeps the teams focused on the project. Do not end up with an excel LOP use the Workflow Board instead to steer and assign tasks. This is great way to have transparency on task tracking and assignment
Don’t assign huge tasks which require several weeks to fulfill. Cut the elephant in pieces. Set up a regular meeting twice or at least once a week.
Hold people accountable and summarize the session, including the actions and deliverables
Have regular reviews with the team in between, therefore use a stand up meeting to gather the team and check for status against the actions planned. (Workflow Board)
Make every tasks as clear and simple as possible, so everybody of the team understands what is expected.
Besides ISHIKAWA you can also use, as part of Visual Management, the so called KAIZEN Board. It is a great opportunity to tackle issues before they become big problems. Also here it is a must to run it with discipline and continuity. It will support you on systematically embed problem solving behavior and continuous improvement culture in you company.

If you want to go deeper in the Ishikawa problem solving I recommend the book from Mickael Réquillard.
In this book, you will discover what an ISHIKAWA diagram is, its different representations and use cases, how to create one and how to effectively exploit the information gathered.
Read more about the book here or get it straight from amazon.