LANGUAGE OF LEAN
Layered Process Audit
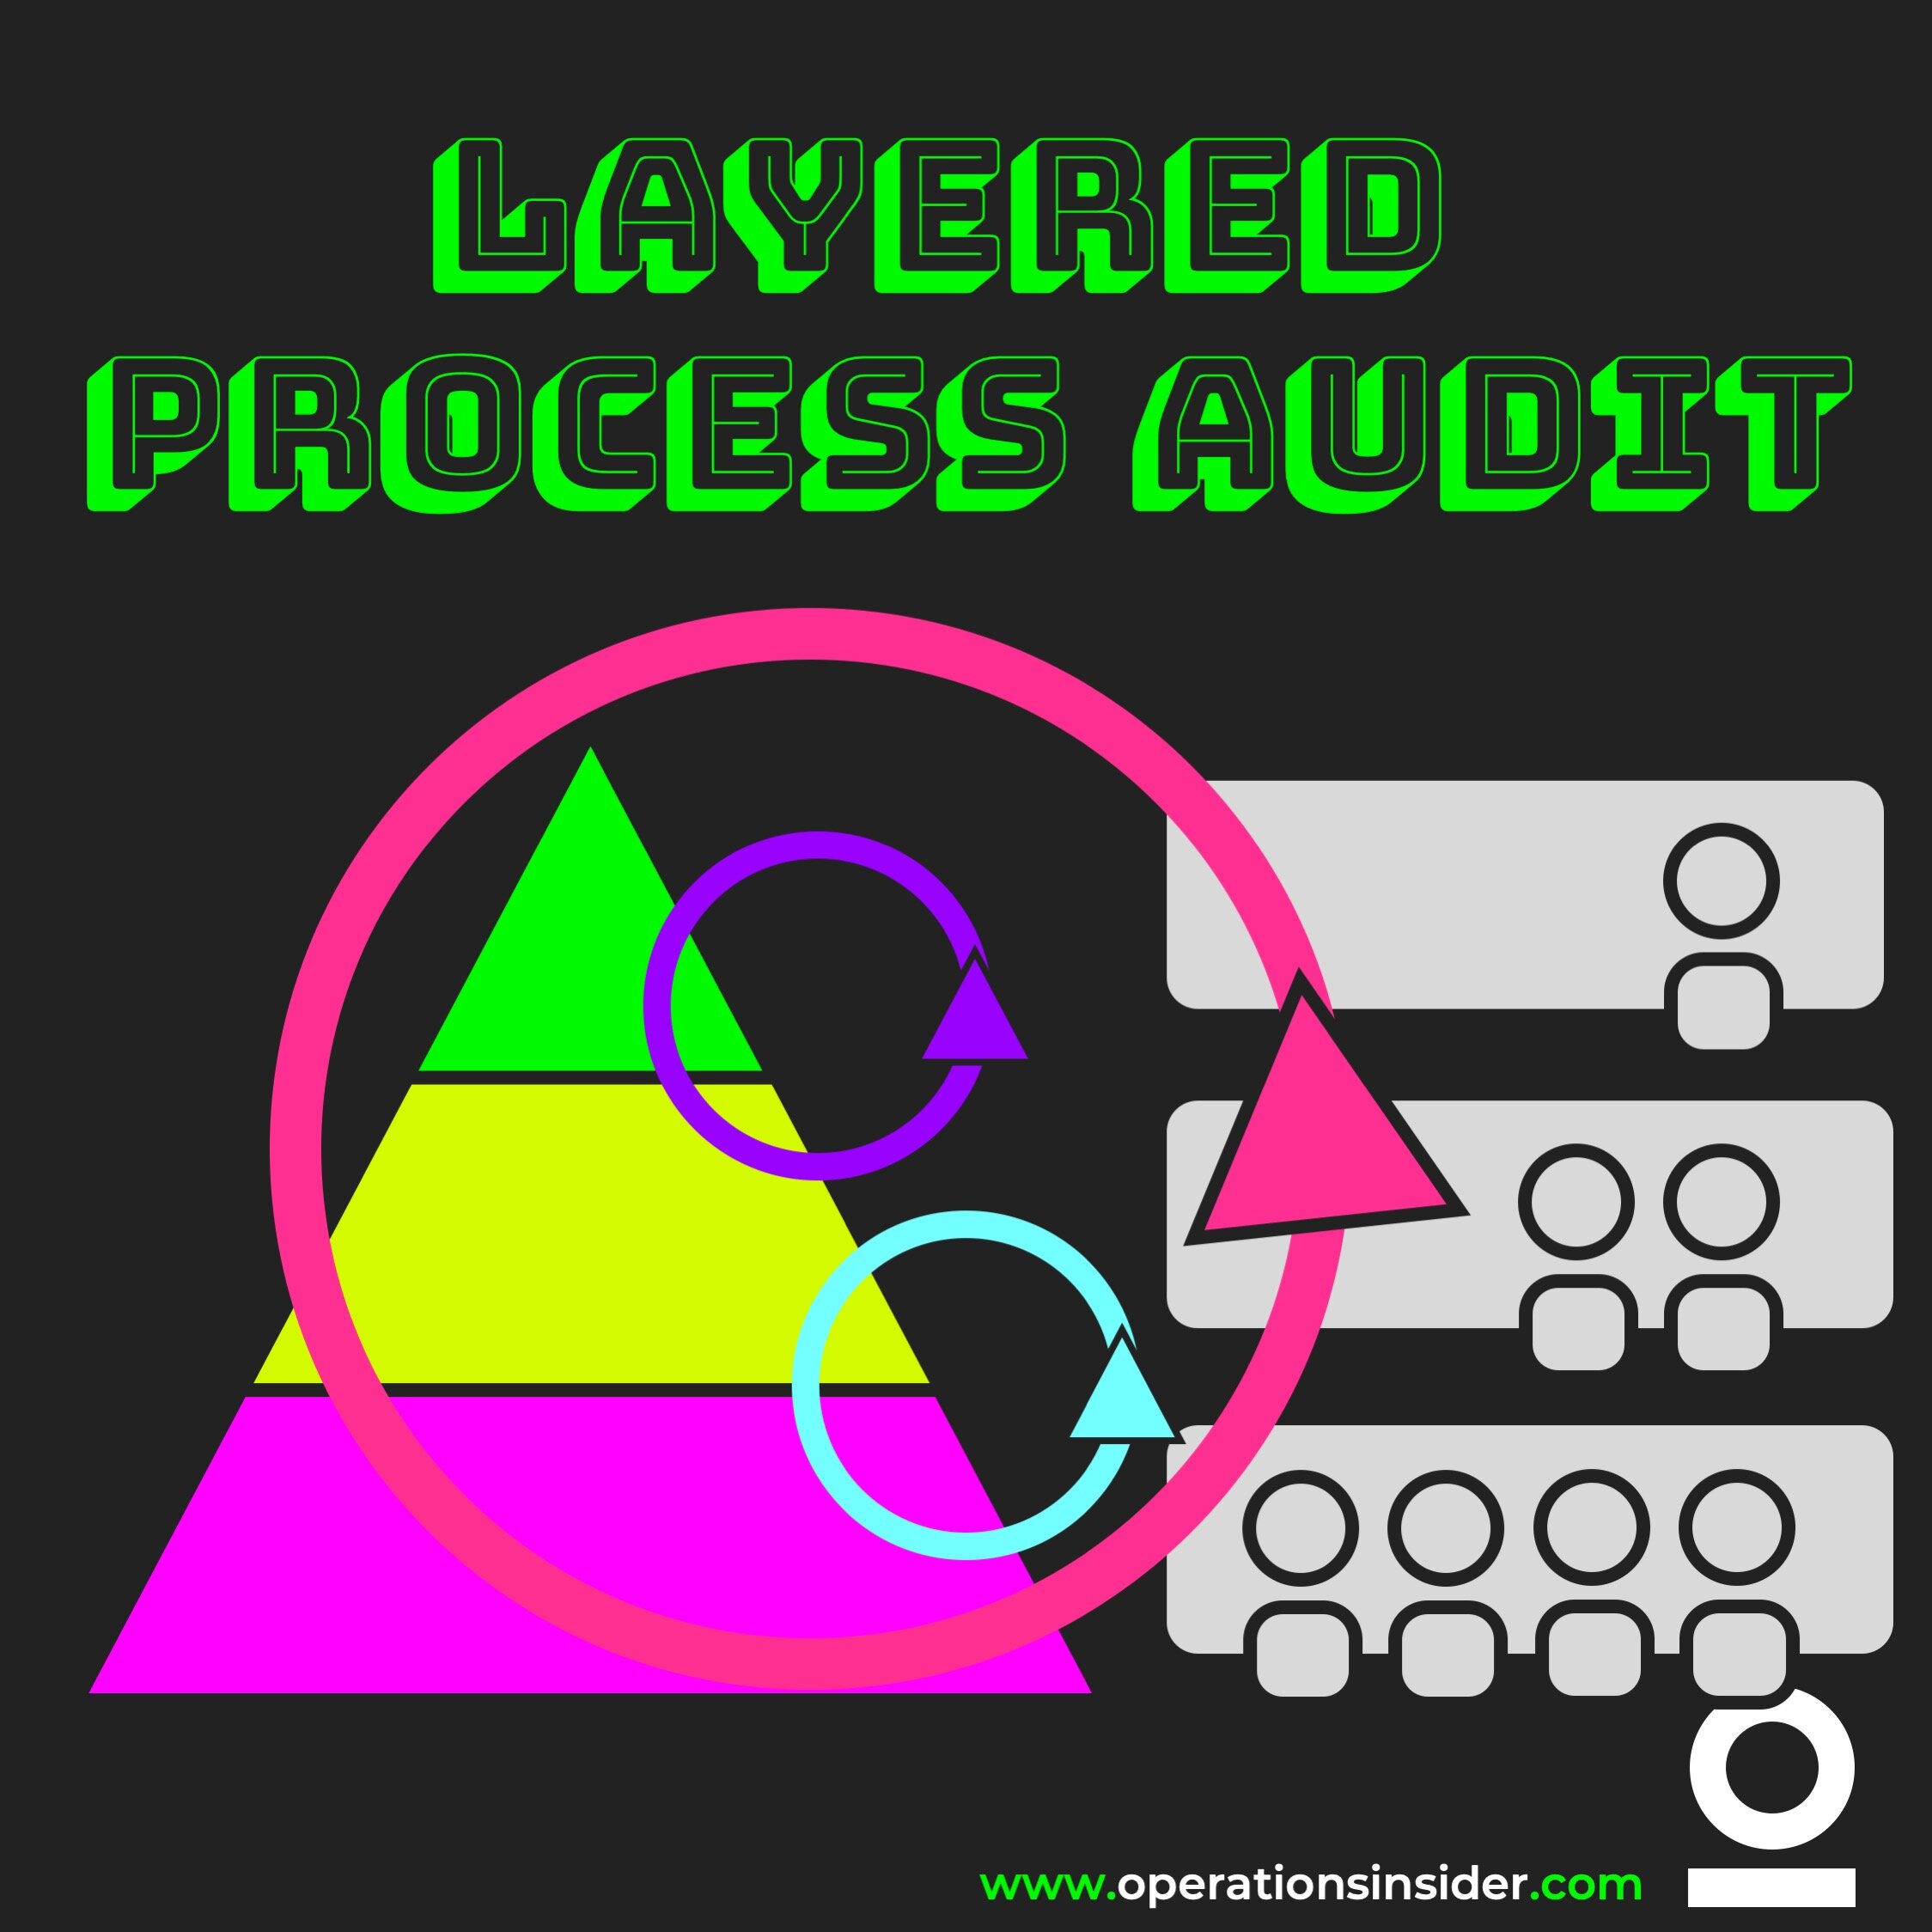
LPA, or Layered Process Auditing, is a quality technique developed for manufacturing management.
Today we will talk about layered process audits.
LPA, or Layered Process Auditing, is a quality technique developed for manufacturing management. When used correctly, LPA brings your organization to improve quality, minimize scrap and rework, plus reduce customer rejections by driving cultural change throughout your company. To gain a better idea and to understand what LPA means we will have a little deep dive.
Layered Audits are a defined approach that devotes time and resources to ensuring that high-risk procedures and error-proofing mechanisms are consistent and functional. Therefore, three important components make up a Layered Process Auditing System:
Full focus on High Risk Processes (HRP) by a list of defined audits
Depending on layer of audit the audit itself is performed from various levels of management
A system of reporting and follow-up to ensure that containment is maintained based on specific needs. But also, to maintain and drive the continuous improvement process in your organization
A full stack of audits
This part of a Layered Process Auditing System is straightforward. Audits are merely a set of questions aimed to investigate machinery or processes. An LPA system's audits should concentrate solely on parts of the value adding process where deviation poses a high risk of producing defective products. E.g. if you have an end of the line quality check station that is measuring crucial parameters or functions that are critical to customers of your product and the calibration is wrong, you are producing in Takt defective or non-conforming products. No need to mention that you should keep an eye on that process. With the help of a proper LPA system you will have the EOL station within the layers allowing containment and corrective action as soon as the station surpasses set tolerances.
Multiple layers of audits comes with multiple layers of auditors
Multiple layers of authority from across your manufacturing department conduct audits on a regular basis, at a predetermined frequency, in an LPA system. For example, once per shift, the Shift Leader conduct an audit that checks the parameters or settings of your EOL-Station. Another layer of management, which may include process engineers, maintenance staff, or even the human resources department, would circulate through the system performing the exact same audit. The sample audit might be performed once a week or once a month by someone in the layer by assigning a number of auditors to this layer and establishing a timetable that cycles through the system's audits. Yet another layer of management, such as the plant manager or even executive staff (the number of levels in an LPA system can vary enormously from facility to facility, depending on your organizations demands and needs). This extra layer of auditors performs the same collection of audits on a rotating schedule, concluding the example audit once a month or once a quarter, for example.
Countermeasures, Containment Actions, Reporting and Improvement Process
In order to have an effective, a Layered Process Audit system you’ll have to combine analysis, measures and improvement process.
If an auditor observes a non-conformance during an audit, the auditor should not only document their findings but also take quick appropriate action to ensure that defective products do not leave the facility. In order to help with the documentation and immediate actions you can use the A3 report and methodology. Simple but effective. You can find it here. Anyway, the findings should be documented and made readily available to management for further analysis. An LPA system is a handy tool for debugging problem areas and identifying areas that are suitable for improvement actions when combined with a strong system for recording and reporting these audit results. A systematic approach will be discussed in the Shop Floor Mgmt. article.
Though Layered Process Audits may be developed to meet a customer or corporate demand, effective LPA systems are built, implemented, managed, accountable to, and owned by your participatory manufacturing management group. A solid LPA system may help you to take proactive control of your manufacturing operations while also enhancing product quality and business bottom line.
Turtle Analysis
“Turtle Diagrams” are an effective tool to understand the processes from both a managerial and workforce perspective.
Turtle Diagrams are an effective method to understand the processes from both a managerial and workforce perspective. These diagrams can also be used to identify gaps in the organizations structure and further develop organizational procedures. From these activities further measures can also be developed for efficiency improvement.
How to use Turtle Diagrams
We will go through the diagram step by step:
INPUT:
Enter details of actual process inputs such as raw material, requirements, information, documents, etc.
PROCESS:
Enter your management process.
OUTPUTS:
Enter your expected or defined output of your process. This can be finished goods, products, records, documentation, etc.
CONGARTS you already described your main process. Now we will complete it with details.
WITH WHAT:
This is asking for materials and equipment. Enter details of materials, components, machinery, test equipment, software, etc. all you use in the process.
WITH WHO:
Resources and competencies. Enter human resources requirements, including qualification, competencies and training requirements or restrictions.
HOW:
The how goes for the supportive processes, procedures and methods. Write down linked processes, pre-processes, supportive processes, instructions, procedures, standard work described, etc.
WHAT FOR:
Key Performance Indicators. Enter the targets, KPIs, performance measures, etc. to measure effectiveness and efficiencies.
Example of a Turtle Diagram
How to use the Turtle Diagram for auditing
When running an internal audit, you can use the Turtle Diagram to understand the relation between input and output for the audited process or activity. In order to get full advantage of the audit, the auditor needs to assess not only the process itself but also the complete surrounding such as the process owner, stakeholders of the process, standard work procedures, training and qualification matrix of persons involved, as well as linked processes. Based on the Turtle Diagram Layout the auditor has a guide to follow through the process audit.
Running the Turtle Analysis
When talking about quality management, process analysis is a key part of daily business. With the Turtle Analysis and the resulting Turtle Diagram you will have the chance to describe processes in a simple and clear one pager. The summary of this one pager is the description of the most important process characteristics. This overview can then be taken to identify risks and weaknesses of the process and build the framework for upcoming quality audits.
The Turtle Diagram gives a clear picture of the links between two process steps or different processes. As usual in manufacturing environment the output of one process step is the input of the other. This can be made visible with the the Turtle Analysis. You starting point is then when interfaces do not run smooth or e.g. important information is lost during hand over phase.
In addition after a Turtle Analysis or audit with the diagram and identified risks and weaknesses you can define specific objectives to be addressed. As mentioned above you can steer and control your improvement actions with pre-defined KPIs, this helps you to visualize deviations from the set course easier.
If you think you need a deep dive on one specific topic found during the Turtle Analysis, we recommend the ISHIKAWA or the 5Why methodology.
Makigami
With the help of a Makigami - administrative processes are recorded and redesigned.
The Japanese term Makigami is developed out of two. First the MAKI (yeah like the Sushi) meaning roll or rolled and KAMI meaning paper. Before you go wild, in the word combination you write kami with “g”. So the question that rises is: What you do with a rolled paper? You use the Makigami to draw and redesign administrative processes. Like with all Lean or Opex activities, once the process is visualized with the help of a Makigami “value-adding” and “non-value adding” activities are marked. On the bottom of the Makigami you will find a time axis which shows the operating time and the pure value adding time.
With the help of the Makigami process analysis, the process is always viewed from the perspective of the process itself, never from the perspective of the employees. This has to be clear also for the waste attack activities in the process. With the Mantra of OPEX: the central question that must be brutaly honest answered: Is the customer willing to pay for this process step/activity? Is this what you are doing adding value to the final product or service?
After you recorded the current state of your process you start to redesign it by asking yourself permanent the following question:
What should the ideal process look like?
Take your planned future development and corporate vision into account to make sure you are not running in the wrong direction.
SIPOC
SIPOC can be used to clearly define process steps within a process chain.
SIPOC is a > Six Sigma tool that summarizes an entire process at the start of an improvement project. SIPOC can be used to clearly identify process steps within a process chain. A SIPOC diagram is only a snapshot of a process. Each of the letters in SIPOC represent the names of the columns in the table:
S – Supplier, I – Inputs, P – Process, O – Output, C – Customer.
The SIPOC method has its origins in Six-Sigma and is used there in the definition phase of a project. To have it summarized see the following Infographic:
By applying this method, it is possible to quickly gain an overview of all the main elements of a process to be examined, even before more in-depth details are worked out.
SIPOC is a very simple and at the same time very effective method that can also be used in various situations in the lean management context.
Possible applications of a SIPOC can be:
Starting a KAIZEN workshop in order to create a common basic understanding.
To achieve a quick overview (top level) for subsequent process optimization
Simple type of documentation for existing processes
Identification of important process participants (who must attend the KAIZEN workshop)
Definition of the process steps to be investigated within a process chain
How to use SIPOC:
The SIPOC method can be used in many different forms, such as Excel spreadsheets, handwritten tables on flip charts or brownpaper versions using cards or post-it notes.
The easiest way is to start by listing the process steps. No more than 5-7 process steps should be listed, since the SIPOC method is not about carrying out a detailed process analysis, but only about gaining a rough overview.
It often makes sense to note down on the process card those departments or persons who carry out the process for the respective process steps, so that it can be recognized immediately who is responsible for the process.
Input: which input factors are necessary to perform the process step? This could be material, information, machines or a service.
Supplier: who provides these input factors? Do they come from an external supplier or from an internal supplier - perhaps as the output of a previous process step in the process chain?
Output: what is produced as a result in the respective process step. These can be material things such as components, assemblies or finished products, or intangible things such as processed information in the form of a document - e.g. a static calculation or an order confirmation.
Customer: for whom the result was actually produced. Make a distinction between external and internal customers. If no customer is found for the output size, it must be checked whether the process step makes sense at all.
Stay Connected
Ad
We want information fast and in a nutshell. We from OI recommend Blinkist* - because it’s simply the best.
* = Affiliate Link


