
LANGUAGE OF LEAN

Hancho
Read how a Hancho will support your organization as the first management level on the shop floor.
A Hancho is the first management level in a lean organization. A hancho is the technical manager or team leader (speaker - Japanese chô) in one part of the process or a small group (Japanese han) and typically consists of 6 to 10 employees. A Hancho masters all processes in his /her area, receives a slightly higher wage (5-10 %) than normal operators and is selected and appointed by the company. The hancho’s responsibilities include reacting to abnormalities and promoting standardized work and the process of continuous improvement.
In order to increase productivity the Hancho is the key player in his role as a team leader. Above the Hancho level your organization, depending on size, has the group leaders which are having a larger number of employees underneath them.
In order to implement the role of a Hancho you need define several aspects upfront. Just answer some questions to yourself:
How many Hanchos do we need?
What will be their daily tasks?
Which qualifications are a necessity?
Which employees are suitable for this role?
Does the employee have the right professional and social qualifications?
At Toyta e.g. the Hancho has following tasks:
You see that most of the time is used for problem solving and the dealing with absence. In best case the Hancho is dedicated to only this tasks, because he contributes the most for a successful continuous improvement management on the shop floor.

Heijunka
How to level production with the help of Heijunka.
Heijunka is a tool in the lean world that is striving for a leveled and smoothed dispatching of manufacturing demands which therefore leads to a reduction of waste. The meaning of levelling is to transform irregular incoming orders into uniform production batches. The target is to bring all demands on the smallest batch size possible based on a leveled production pattern. The Heijunka Board visualizes the predefined production plan for the production process. The beauty of it is that it enables you with little effort of control to implement a steady and synchronous flow of production.
If you are in a leading manufacturing position you already know how painful it can be to maintain a steady flow of work.
Customer demands are typically not perfectly leveled and this fluctuation needs to be translated into a defined takt that is given by your production process. To keep up with the incoming stream of orders and to avoid overproduction and therefore tied up cash, Heijunka can help you lowering the peaks and smoothing out production.
Heijunka is a well-known lean method for smoothing and reduce the over stressing of a production process. Heijunka is Japanese and means roughly translated levelling. The main reason for implementing Heijunka is a faster reaction time on fluctuating demands and improving the utilization of installed capacity.
With the help of Heijunka you minimize the sizes of batches to smallest size possible and start processing customer orders based on demand. This will support you on reducing your inventory as you will stop producing based on utilization of line capacity and then pile up finished goods without being sold.
At the bottom, Heijunka allows you to produce and deliver value to your customer at a steady pace and gives you the chance to react faster on deviations, while not overstressing the process. Therefore this method gives you always two options for levelling your production: By type or by quantity.
Balancing by type:
Go through your portfolio and define the average demand of each product. Based on the average demand the production is smoothed out to meet it. The target is to level the capacity of our line. Use Heijunka to keep up with the demands of each product of your portfolio and use it to visualize the production plan.
Balancing by quantity:
The main road blocker to establish a smooth and continuous production flow is producing in batches. The target is clear: produce only what is ordered. Therefore, Heijunka enables you to level your production by the average volume you get. By levelling your production this way, you will be able to achieve all demand by the end of the week. With the help of Heijunka you will keep your processes running without overburden it when unplanned peaks are coming in.
The Heijunka Box is a tool implemented on the shop floor in order to visualize the workload that needs to be fulfilled in order to meet the average demand. Simply spoken it has cards spread over the week for each product in a logical sequence to reach optimal flow.

The Heijunka Board
Usually the Heijunka box is set up in a matrix with the first column separated by product type for each line, the following columns are the workdays of the week. Therefore your Matrix defines Product type and the quantity that needs to be produced on a specific day. Two ways are most common, either as boxes where cards are placed in or as a board with magnetic cards that stick on it.
Depending on your installed capacity and the team size you want to cover with Heijunka you might need multiple Heijunka boards. Typically the cards you use are having the format of Kanban cards, that are following the process of the processed good until the end and then are placed back to the collection box for new planning.
Heijunka is a great lean method that allows you to organize your workflow around average customer demand. You protect your processes and employees from over stressing due to uneven production and quantity sizes. Furthermore, it supports you on realizing a complete pull system throughout production.

Pareto Chart
A Pareto Chart is used to help determine the waste characteristics of a product.
A pareto chart is used in order to determine the waste characteristics of a product/good but also of processes. They are sorted onto a cart so that the most frequent defects can be visualized and stand at first place.
Today, I am writing this blog post after discussing several times with colleagues who want to understand the Pareto chart (or Pareto diagram) more deeply.
The Pareto chart is one of the basic tools of quality management. Usually, this chart consists of a combined bar and line graph. The vertical bars are representing the quantity of defects, and the line represents a cumulative percentage of the defects.
The descending order of bars is from left to right. The bar on the left will have the highest value, and the bar on the right side will have the lowest value.
Let’s discuss this in detail.
Pareto Chart
Sometimes, it is challenging for you to understand the problems and their causes. Instead of focusing on the root cause, you spend your time, solving problems, which were influencing the project least.
The Pareto diagram can help you overcome this situation. The Pareto diagram can help you segregate the defects and their cause. Once you get this info, you can focus on the cause which is generating the most defects.
The Pareto diagram is based on the Pareto Principle, which was developed by an Italian economist named Vilfredo Pareto. He found out that 80% of the wealth was spread to 20% of the population. Therefore, pareto is also known as the 80/20 rule.
We could now list several examples where this rule is confirmed such as
80% of the defects are coming from 20% of the process
or
80% of customer complaints are coming from 20% of all defects detected
or
20% of the defects are causing 80% of the problems…
The list can go on and on.
In general, this phenomenon can be interpreted as follows: Roughly 80% of the problems will be due to 20% of the causes, or the majority of issues will be due to a small number of causes.
However, keep in mind that the above rule is a general rule and the ratio is not absolute.
The Pareto chart is mainly used in quality management or Six Sigma approaches. This chart helps you to find the majority of the problems and their root causes. You then should focus on tackling those causes and therefor solve the majority of the problems.
How to Draw a Pareto Chart
Drawing a Pareto chart is very simple. The most important step is to collect the correct data.
The steps to drawing a Pareto chart are as follows:
Categorize your potential causes
Specify the measure, e.g. quantity, costs per failure, downtime, etc.
Set a time frame you measure, e.g. per shift, per week, etc.
Measure Measure Measure (If you can’t measure you can’t control)
Separate the data based on the categories
Draw a bar chart with causes on horizontal axis and number of occurrences on the vertical axis (Excel gives you predefined templates)
The category with the lowest quantity will be at the right and the highest quantity on the left
If you don’t have the histogram preset chart in excel - define a second row with the percentage value. Accumulated up to 100%. This will be your secondary axis. The values in percent will form the curve of distribution.
.To make it short - it should look like this:

Pareto Chart
Now, you can focus on the causes generating the majority of problems, analyze them, find their real root cause(s), and start to get rid of the issues one by one.
This chart can help everybody to identify causes of the most common problems. It also supports on prioritizing tasks and activities for KAIZEN Workshops or simply fire fighting. Having some Excel skills, it is very easy to create a Pareto and also often helpful communicating your actions to the upper management - you can bring it to the point.

This reading pick is not focusing on the professional approach of the Pareto (meaning quality matters in manufacturing) but more looking at the personal usage of the 80/20 Rule. We love it as it shows you how to focus on what really matters in live.
Read more in our reading picks here.

5S
The 5S Method is a five-level system for the provision of safety, cleanliness and orderliness on the workplace.
The 5S Method is a five-level system for the provision of safety, cleanliness and orderliness at the workplace. The term „5S“ is coming from 5 Japanese words that begin with the letter „S“.
These 5 words describe the 5 principles for the organization of the workplace:
1S – SEIRI
Cleaning: Sorting-out and get rid of all unwanted objects.
2S – SEITON
Orderliness: Clean-up and proper arrange tools needed.
3S – SEISO
Cleanliness: Maintain cleanliness at the workplace and keep the standards established through 5S workshops.
4S – SEIKETSU
Standardization: Establishing work standards developed by 5S sessions.
5S – SHITSU
Discipline: Observing compliance of new work standards and drive for continuous improvement.
Why do we need 5S?
Goals of the 5S during the implementation:
Safety
Flexibility
Quality
Costs
Ergonomics
How can you implement 5S at your organization?

How to implement 5S
The 5 steps of the 5S-Method:
Sorting out all unnecessary objects at your workplace
All needed objects have to be arranged in a proper way
Keep your workplace clean
Standardize the steps 1 to 3
Keep your new standard or improve it even more
5S is a continuous process!

The 5S checklist
In order to maintain the 5S procedure and standard you should be implementing a routine of a so called 5S audit. The 5S audit is an instrument of sustainable implementation of the five step system for safety, cleanliness and order at your workplace.
Therefore 5S is relevant in all areas of your company, no matter if you are working in a office or your focus is on the shop floor. To maintain the 5S implementation and the ongoing improvement of all 5 steps. The audit can support you on identifying deviation and to improve.
So why do you need the 5S Method?
It supports you on
Reduction of uncleanliness and its causes in the company
Reduction of latent waste in the company (e.g. untidiness, unneeded objects)
Reduction of defective equipment and tooling
Reduction of deviations from standardized manufacturing procedures due to unnecessary objects and frequent searches for misplaced objects
Increasing the awareness of the employees about tidiness, cleanliness, waste and deviations from standardized manufacturing procedures
Enhancing the positive impression of the company towards the customer
So what are the goals when you implement 5S in your company?
1 Increase safety at the workplace
Everything lies in its right place and employees receive a standardized and up-to-date description of their workplace
The employees know where to find everything needed in the case of an emergency
Markings on the floor are used as a visual control aid to help the employees to stay clear of any dangerous situations
2 Increased capability to react
Expeditious reaction to the requests of the customer and expediting the manufacturing process
By involving all employees, the internal flow of communication is enhanced along with the identification and removal of mistakes
It supports the expeditious preparation of e.g. work procedures, replacement of tools, increased flexibility of the employees, streamlines the work processes, increases the general economy by making the work procedures more effective; and expedites the continuous process of enhancement
Mistakes and deviations from the standardized work procedures become an exception and can be quickly eliminated

This reading pick will show you the methodology as well as real doing and conducting of 5S Sessions. It is a great guidance and a step by step instruction with lots of advice and practical tools that will allow you to conduct your 5S project from A-Z.
Read more in our reading picks here.
3 Enhanced quality
The proper arrangement of material and equipment decreases the amount of defective products and improves the repeatability of the work process
Enables the employees to determine at first glance what is needed to do to ensure quality
Makes the problems more perceivable and thus enables their solution
4 Cost reduction
Shortens unnecessary searches and reduces the time needed to find objects
Shortening time for exchange of tools > SMED
Creating new areas
Eliminating all unnecessary objects
Too excessive or insufficient supplies are discovered and are made visible
Expedient realization of counter-measures
5S designates the 5 basic principles for creating a clean, well-arranged and effective workplace with competent employees – the basis is orderliness = 5S.
5 Developing a “Visual Workplace”
In the case of a visually created workplace the work procedures are adjusted to enable all employees to have the possibility to observe the actual work process
Visualization:
Organization of the workplace
Manufacturing process
Distractions, such as defective objects, sources of danger etc.
Production indicators (plan, overproduction, or as the case may be, underproduction)
How can a 5S Audit support you?
The 5S Method makes sure that each workplace, in the production or office, is organized according to the principles of cleanliness, orderliness and safety
To secure the permanence and the continuity of adherence to the defined 5S standards it is necessary to regularly conduct 5S Audits
For the different areas of Production or Administration and others, specific questionnaires are prepared, on basis of which the obvious deviations from the defined planned state can be detected
The 5S questionnaires are combined with a list of counter-measures necessary to rectify the situation along with the names of responsible persons

Push vs Pull Principle
One of the four building blocks of lean production. Push vs Pull production.
The pull principle is one of the main blocks in lean manufacturing > pull manufacturing. The customer demand determines which good will be produced and in which quantity. Max/Min inventory levels are agreed with suppliers and customers. This gives you the opportunity to limit overproduction.
In a pull process a workstation or process step is only being triggered when the downstream processes are free to take the output. This means that only when the customer initiates a need the value adding is started. By this a customer can be seen as internal as well as external one. This is lovely as you make sure that only what you will sell will be produced.
Pull is always to prefer against push. As it allows you to manage the WIP and inventories in between workstations which has a straight impact on your lead time. To successfully install a Pull System you have three choices, it is either the well known continuous flow installed, sequential pull or the replenishment pull.
All three types of connection will help you to achieve different levels of Pull in your environment.
No matter what it always comes down to three factors in your system:
Having max one piece of inventory between two process steps
Having a fix production sequence
and having a max number of parts waiting
Thinking about the three types of a Pull System, the continuous flow system has the highest level of Pull, as all three factors are highly involved. Only One Piece at the time and in between two process steps which means a fixed sequence as well as max one part waiting for the next process step.
If you have several workstation linked in one main manufacturing process working on one final product you have a work cell or simply a production line, depending on the shape you can call it e.g. U-cell.
With the sequential pull system you will have the second best choice of a pull manufacturing. It will have a fixed quantity, the sequence of production is defined but with a max number of WIP allowed between process steps. Basically you will allow buffers in your manufacturing. This can typically be seen in FiFo lines (First in First out).
Last but not least we have a look on the Replenishment Pull. This is in other words your supermarket in the production and your third and last option of implementing pull. The supermarket has a maximum number of components, parts or products waiting to be worked or processed on. But it is not known which one will be next. This type of inventory is usually steered or controlled using the Kanban systematic.
To put it in a nutshell - the following table should be fine to give you an overview:


Autounloading
In the lean world “auto unloading” means that every machine is automatically unloading the processed part or component, so that the operators’ task is reduced to only loading the machine.
In the lean world “auto unloading” means that every machine is automatically unloading the processed part or component, so that the operator’s task is reduced to only loading the machine. This also refers to the chaku chaku principle. The correct lean term of autounloading is the Hanedashi Principle which is explained here.
Ishikawa (Fishbone Diagram)
An ISHIKAWA is a chart that resembles a fish skeleton, with a main spine and branches (bones) drawn at a slant off the spine; used for quality control in two main ways.
If you are running problem-solving you will come across the so called ISHIKA (or Fishbone) diagram. An ISHIKAWA is a chart that resembles a fish skeleton, with a spine and bones drawn slanting off the spine; used for quality control in two main ways:
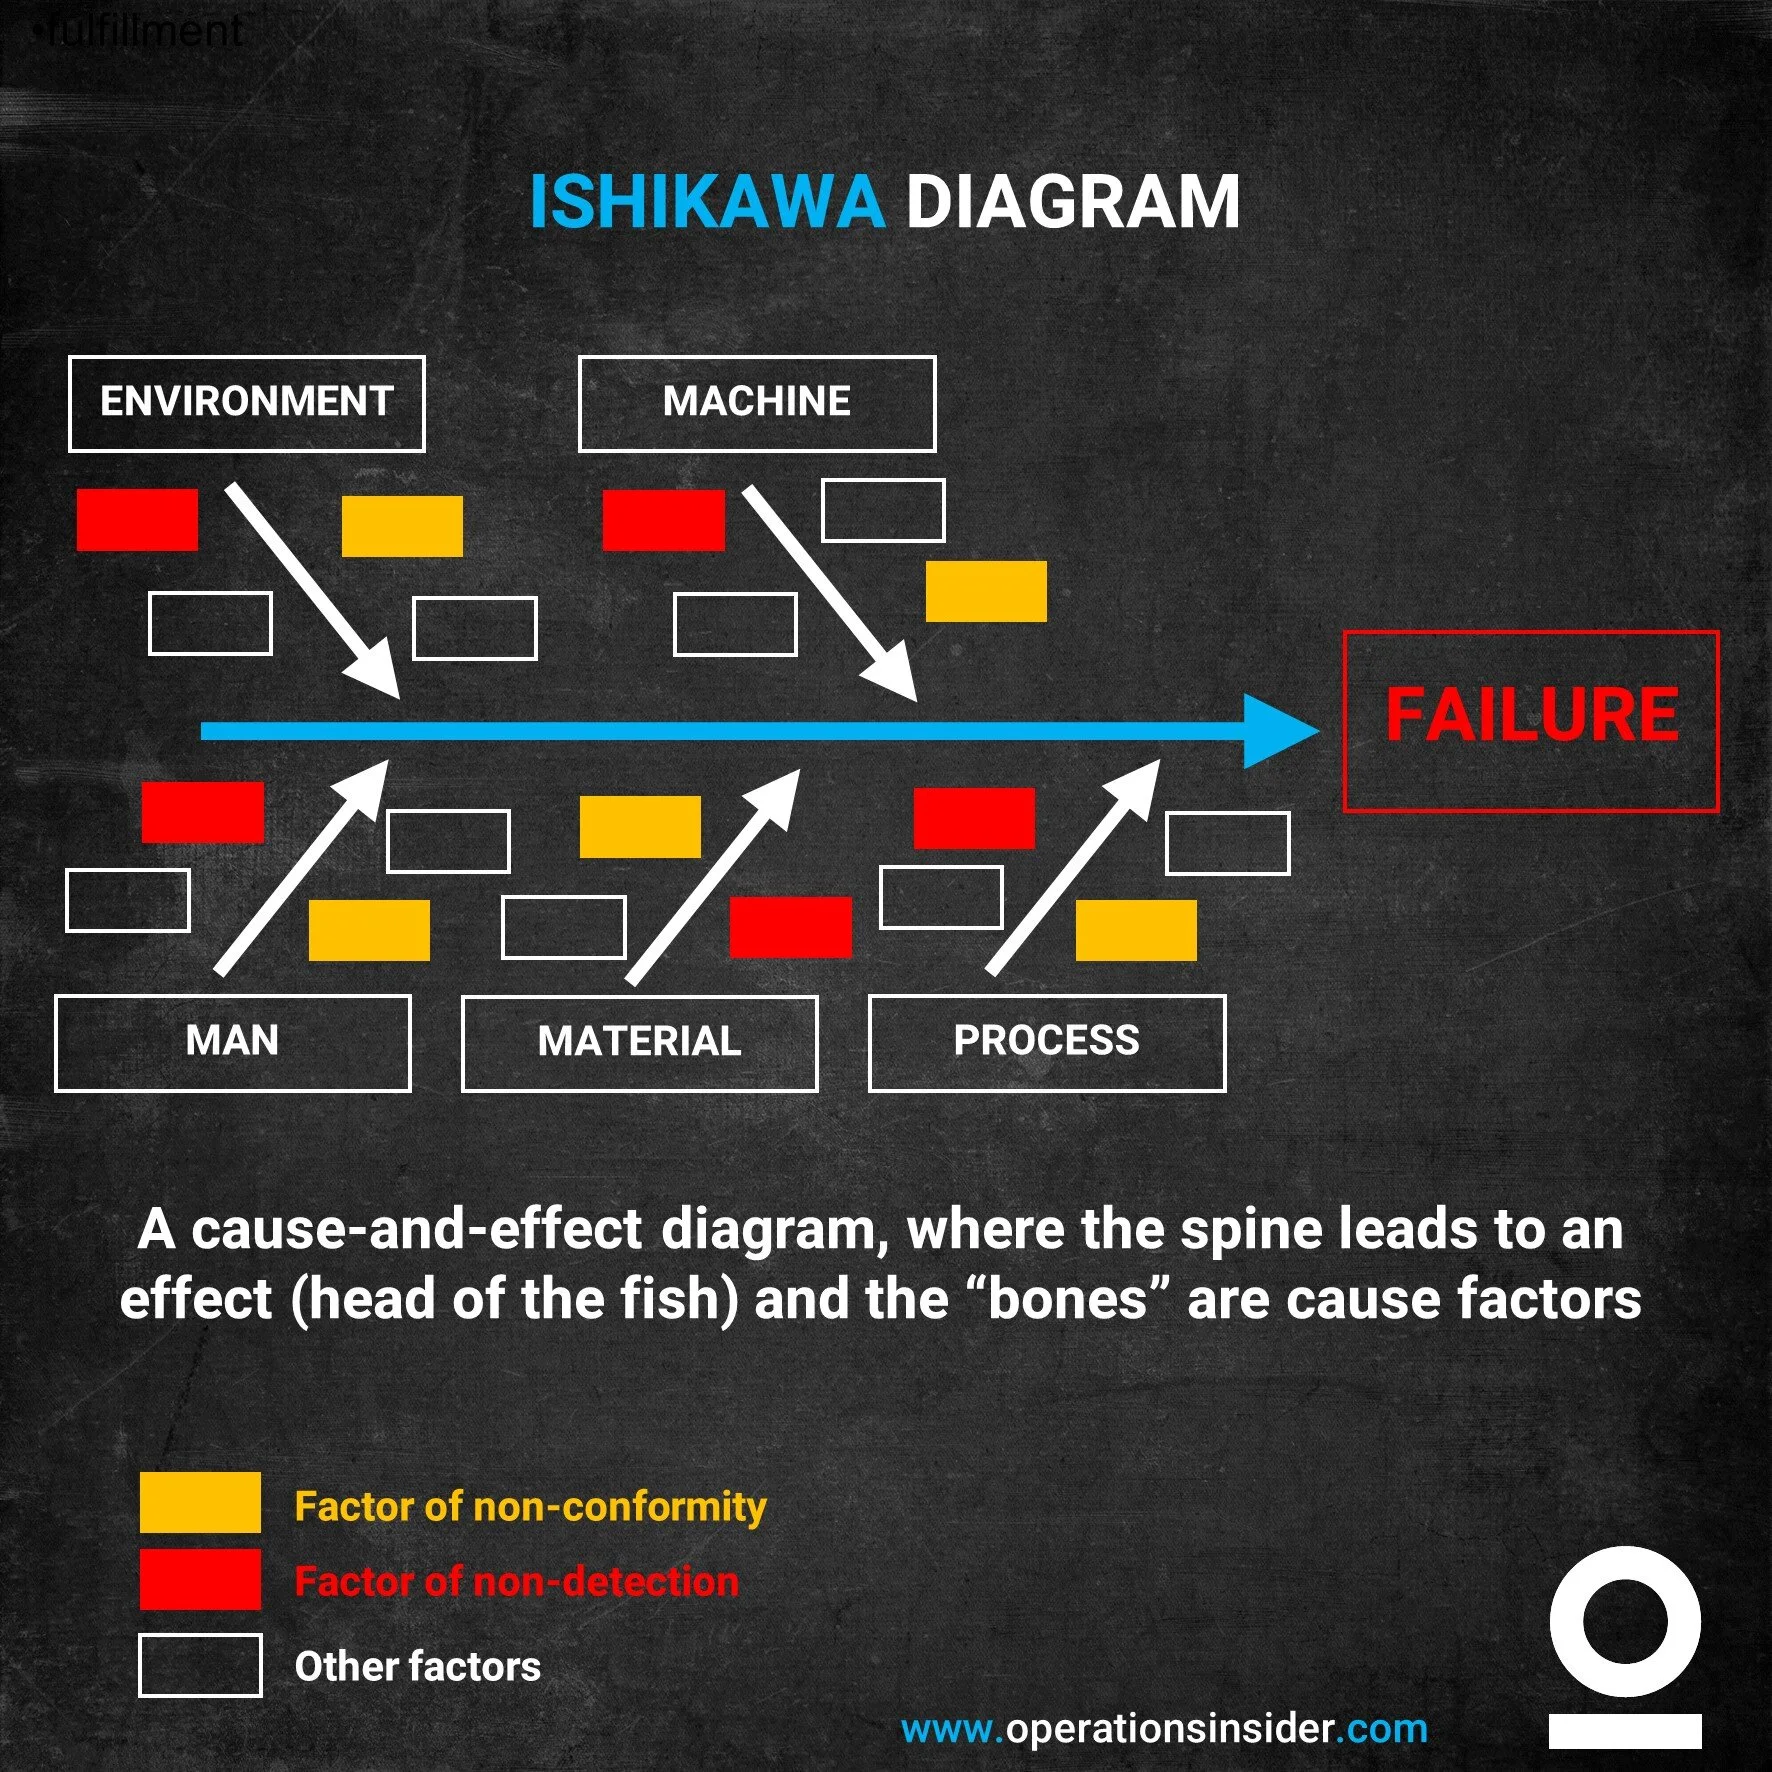
As a cause-and-effect diagram, where the spine leads to an effect (head of the fish) and the “bones” are cause factors
As a subdivision of quality requirements, where the spine represents a quality objective and the bones describe subsidiary traits or measurements that are important but are not the end in themselves. (Sometimes referred to as a Reverse Fishbone)
The fishbone diagram is simple to use and allows a quick and effective root cause analysis and to understand what corrective actions can be taken to have fast success. It is used for brainstorming and often in conjunction with the 5 Why Methodology.
In a ISHIKAWA, the various causes are grouped into categories and the causes cascade from the main categories, flowing towards the effect, forming what resembles a fishbone appearance.
The first step is to brainstorm all possibilities that could cause the problem and then drill it down to the factors that are causing the effect. Once found it is the task to eliminate them. It enables the team to focus on why the problem occurs and not the history of symptoms of the problem. It also displays a real time snap shot of the collected inputs of a team as it is updated.
How to Conduct a Fishbone Diagram
Draw the box on the right of a flip chart, large brown paper or white board, and write the problem statement (effect) in the box. Be as clear and specific as you can about the problem.
Now draw the line going from left to right as the ‘spine’, connecting to the problem statement.
Draw the ‘fishbones’ emanating from the spine. These represent the main cause categories.
Now label each Fishbone category. There are two options here. You can use the generic cause categories of Environment, Machine, Man, Material Methodology, which is easier to use for a team that is relatively new to this method but, but you can also use the brainstorming in the group to define the major categories related to the specific problem.
Now brainstorm all the causes to the problem. You could use the approach of writing each cause on a sticky note, going around the group asking each person for one cause. Continue going through the rounds, getting more causes, until all ideas are on the board.
For each cause, agree in the group which category the issue should fall in. (An issue can be addressed in several categories) and continue this process until the group have run out of ideas and all potential causes are at least placed under one category.
Next, get each team member a marker or sticker dots to mark the top three causes they think have the highest effect on the issue.
Not always mentioned but for us very important – also differentiate between the factors in three sectors
Factor of non conformity (process, drawing, etc.)
Factor for non detection
Simple cause
Once completed, the facilitator adds up all the markings for each cause and selects the top three with the highest scores. These three issues will now form the basis of additional investigation in order to find the root cause. The team may then investigate these causes further and use problem-solving techniques like 5 Whys to eliminate their occurrences.
An example Fishbone Diagram
A typical use case in industry is that a production facility has a too high scrap rate. Manager comes in and says “solve it”. As mentioned above the cross functional team gathered all data and ideas during a brainstorming session and listed all possible causes into the main categories.
The next step would be to pick the top three causes and delve deeper to find the true root causes.
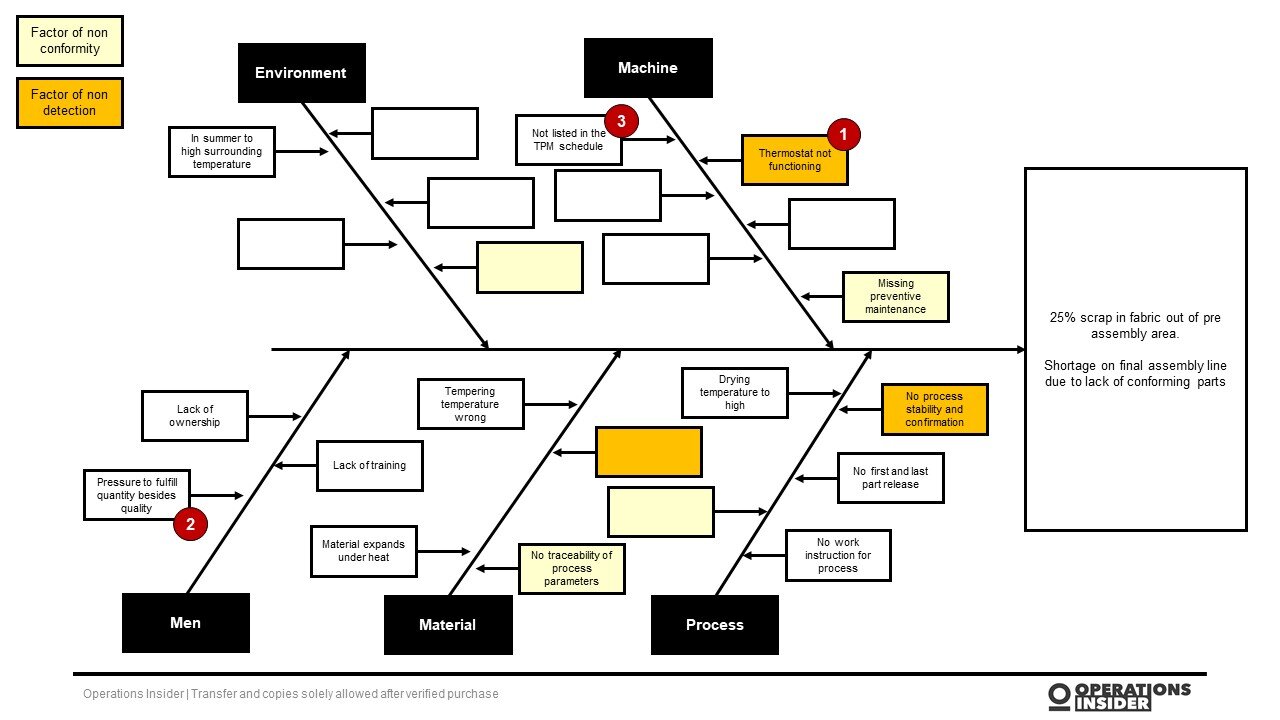
Example of an Ishikawa Diagram
Some hints:
Remember, as with any task-based activity, always close a problem solving session with actions, clearly assigned owners and due dates – “Who is doing what by when?” This is important, as it keeps the teams focused on the project. Do not end up with an excel LOP use the Workflow Board instead to steer and assign tasks. This is great way to have transparency on task tracking and assignment
Don’t assign huge tasks which require several weeks to fulfill. Cut the elephant in pieces. Set up a regular meeting twice or at least once a week.
Hold people accountable and summarize the session, including the actions and deliverables
Have regular reviews with the team in between, therefore use a stand up meeting to gather the team and check for status against the actions planned. (Workflow Board)
Make every tasks as clear and simple as possible, so everybody of the team understands what is expected.
Besides ISHIKAWA you can also use, as part of Visual Management, the so called KAIZEN Board. It is a great opportunity to tackle issues before they become big problems. Also here it is a must to run it with discipline and continuity. It will support you on systematically embed problem solving behavior and continuous improvement culture in you company.

If you want to go deeper in the Ishikawa problem solving I recommend the book from Mickael Réquillard.
In this book, you will discover what an ISHIKAWA diagram is, its different representations and use cases, how to create one and how to effectively exploit the information gathered.
Read more about the book here or get it straight from amazon.
Stay Connected

Ad
We want information fast and in a nutshell. We from OI recommend Blinkist* - because it’s simply the best.
* = Affiliate Link


