LANGUAGE OF LEAN

Demings 14 Points
The 14 principles of good mgmt. described by Deming in his book "Out of the Crisis" can be seen as crucial factors for successful corporate transformation.
In this article we introduce you to Deming's 14 management principles and how they have impacted the Lean Management System.
The person Deming
William Edward Deming was an American professor, engineer, and consultant who studied electrical engineering and mathematical physics before becoming a consultant. He participated in a variety of topics, including statistical process control, systems thinking, and the human psyche. His work as a quality management consultant for Japanese firms was possibly his most well-known accomplishment. As a result, the Deming Prize has been given out to this day.
Nowadays the PDCA-Cycle is well known globally (or Deming Circle). But fun fact – it initially was called the Shewart-Cycle based on his cooperation with Dr. Walter Shewart.
Deming’s 14 POINTS OF GOOD MANAGEMENT
Deming offers 14 principles that he has identified as success elements for effective organizational transformation in his book "Out of the Crisis." Here they come:

To be competitive, set an unchanging business aim of consistent product and service improvement.
Put the new philosophy into practice. We are in a new phase of economic development, and (western) management must adapt to new circumstances.
Stop relying on quality assurance. Quality is not checked at the completion of the process but is built in from the initial stage.
Stop giving out contracts based on the lowest price. Instead, analyze a product's or service's entire cost. For each product, use only one supplier with whom you can develop a long-term and trusting connection.
Consistently and constantly improve the framework for manufacturing things.
Introduce "Training on the Job."
Introduce a fresh leadership style. The focus of leadership should be on assisting people and equipment in doing their tasks effectively.
Take away the system's fear. A culture that freely acknowledges mistakes aids in the identification of root causes, long-term solutions, and hence continuous improvement.
Remove the barriers that exist between departments. Purchasing, development, production, and sales must all work together to identify and address problems in production and service at the earliest possible time.
Employees who want zero errors or increased levels of productivity should avoid slogans and goals. Recognize that many of these goals are impacted by the system rather than by the individuals and that this incompetence demotivates employees.
Employees are no longer held to fixed quotas or performance targets. To make it clear to employees why tasks are important and should be completed, replace them with effective leadership.
Remove any barriers preventing employees from becoming proud of their work.
Introduce a holistic sublimed program that challenges and motivates each person's personal growth.
To enhance transformation, take the services of everyone in the organization.
Getting Demings principles IN THE LEAN MANAGEMENT SYSTEM
According to Deming, the 14 points of excellent management have evolved over time. While in the first point, he discusses relatively small-scale measures that facilitate a company's success, in the second point, he discusses large-scale measures that aid a company's success, the final principles are more basic statements about good business management.
In a lean workplace, we can apply any or all of the principles. Starting with a business vision that explains why the company exists and how it intends to improve over time. Continue with a new perspective on quality. Rather than employing a large number of quality control personnel to inspect the product at the end of the manufacturing process and, if needed, rework the product, the goal should be to incorporate quality into the product, this means that the manufacturing process should be built in such a way that manufacturing errors are avoided from the start (Poka-Yoke) or recognized quickly, allowing for a fast reaction rather than allowing the product to flow to the end of the line. This, of course, necessitates highly qualified staff who can best learn these abilities of immediate quality control directly at the process, as well as a culture that allows for the detection of errors without having to face negative consequences.
The style of thinking in value streams is another aspect of the Deming principles that becomes obvious. It explains how departments must coordinate to predict future difficulties in product manufacturing and services at an early stage. This demands strong cooperation among purchasing, development, sales, and production departments. He also states in principle four that decisions (such as purchasing) should not be made solely on the basis of the lowest offer but should always examine the whole expenses of a decision. What use is a 5 cent purchase price reduction if I have to budget for a 6-month replacement cycle in my warehouse? I have over 5 cents in expenses for storage, transportation, and stalled capital.
Another significant point is the shift in leadership perceptions. Deming is given the following quote:
It is the process, not the people.
Giving employees targets or piecework rates, in his opinion, makes no sense because they have no control over the results, which are decided by the system. Many people would now believe that if there are no goals, nothing will function. The distinction, in my opinion, is in the type of goals. If a corporation has a goal to grow by 10%, you might consider how to improve the system to meet this goal. You don't just hinder all of your employees' goals by 10%; you think about how you might reform the system.
Deming probably assumes that an employee is always prepared to give his all and that management is only demotivating him because it sets expectations for him that are unachievable in the current system. He goes on to say that staff wants to learn more and are always looking for ways to improve. This is a viewpoint that I can understand. When I consider the many employees I've met, I'm struck by how willing the young employees are to give their all and go hungry. Employees who have been disrupted for a long time by "the system" now only do what is necessary and seek challenges outside of work because they are not challenged or motivated at work.
I can only advise everyone to review the 14 Deming management principles again and again and to ask themselves which of the concepts are continuously followed and which are not.
Brown Paper Method
The Brown Paper Method is a practical tool to develop or improve process management in your organization.
What is the Brown Paper Method?
In this article we want to talk about the Brown Paper Method (BPM) in the context of process management.
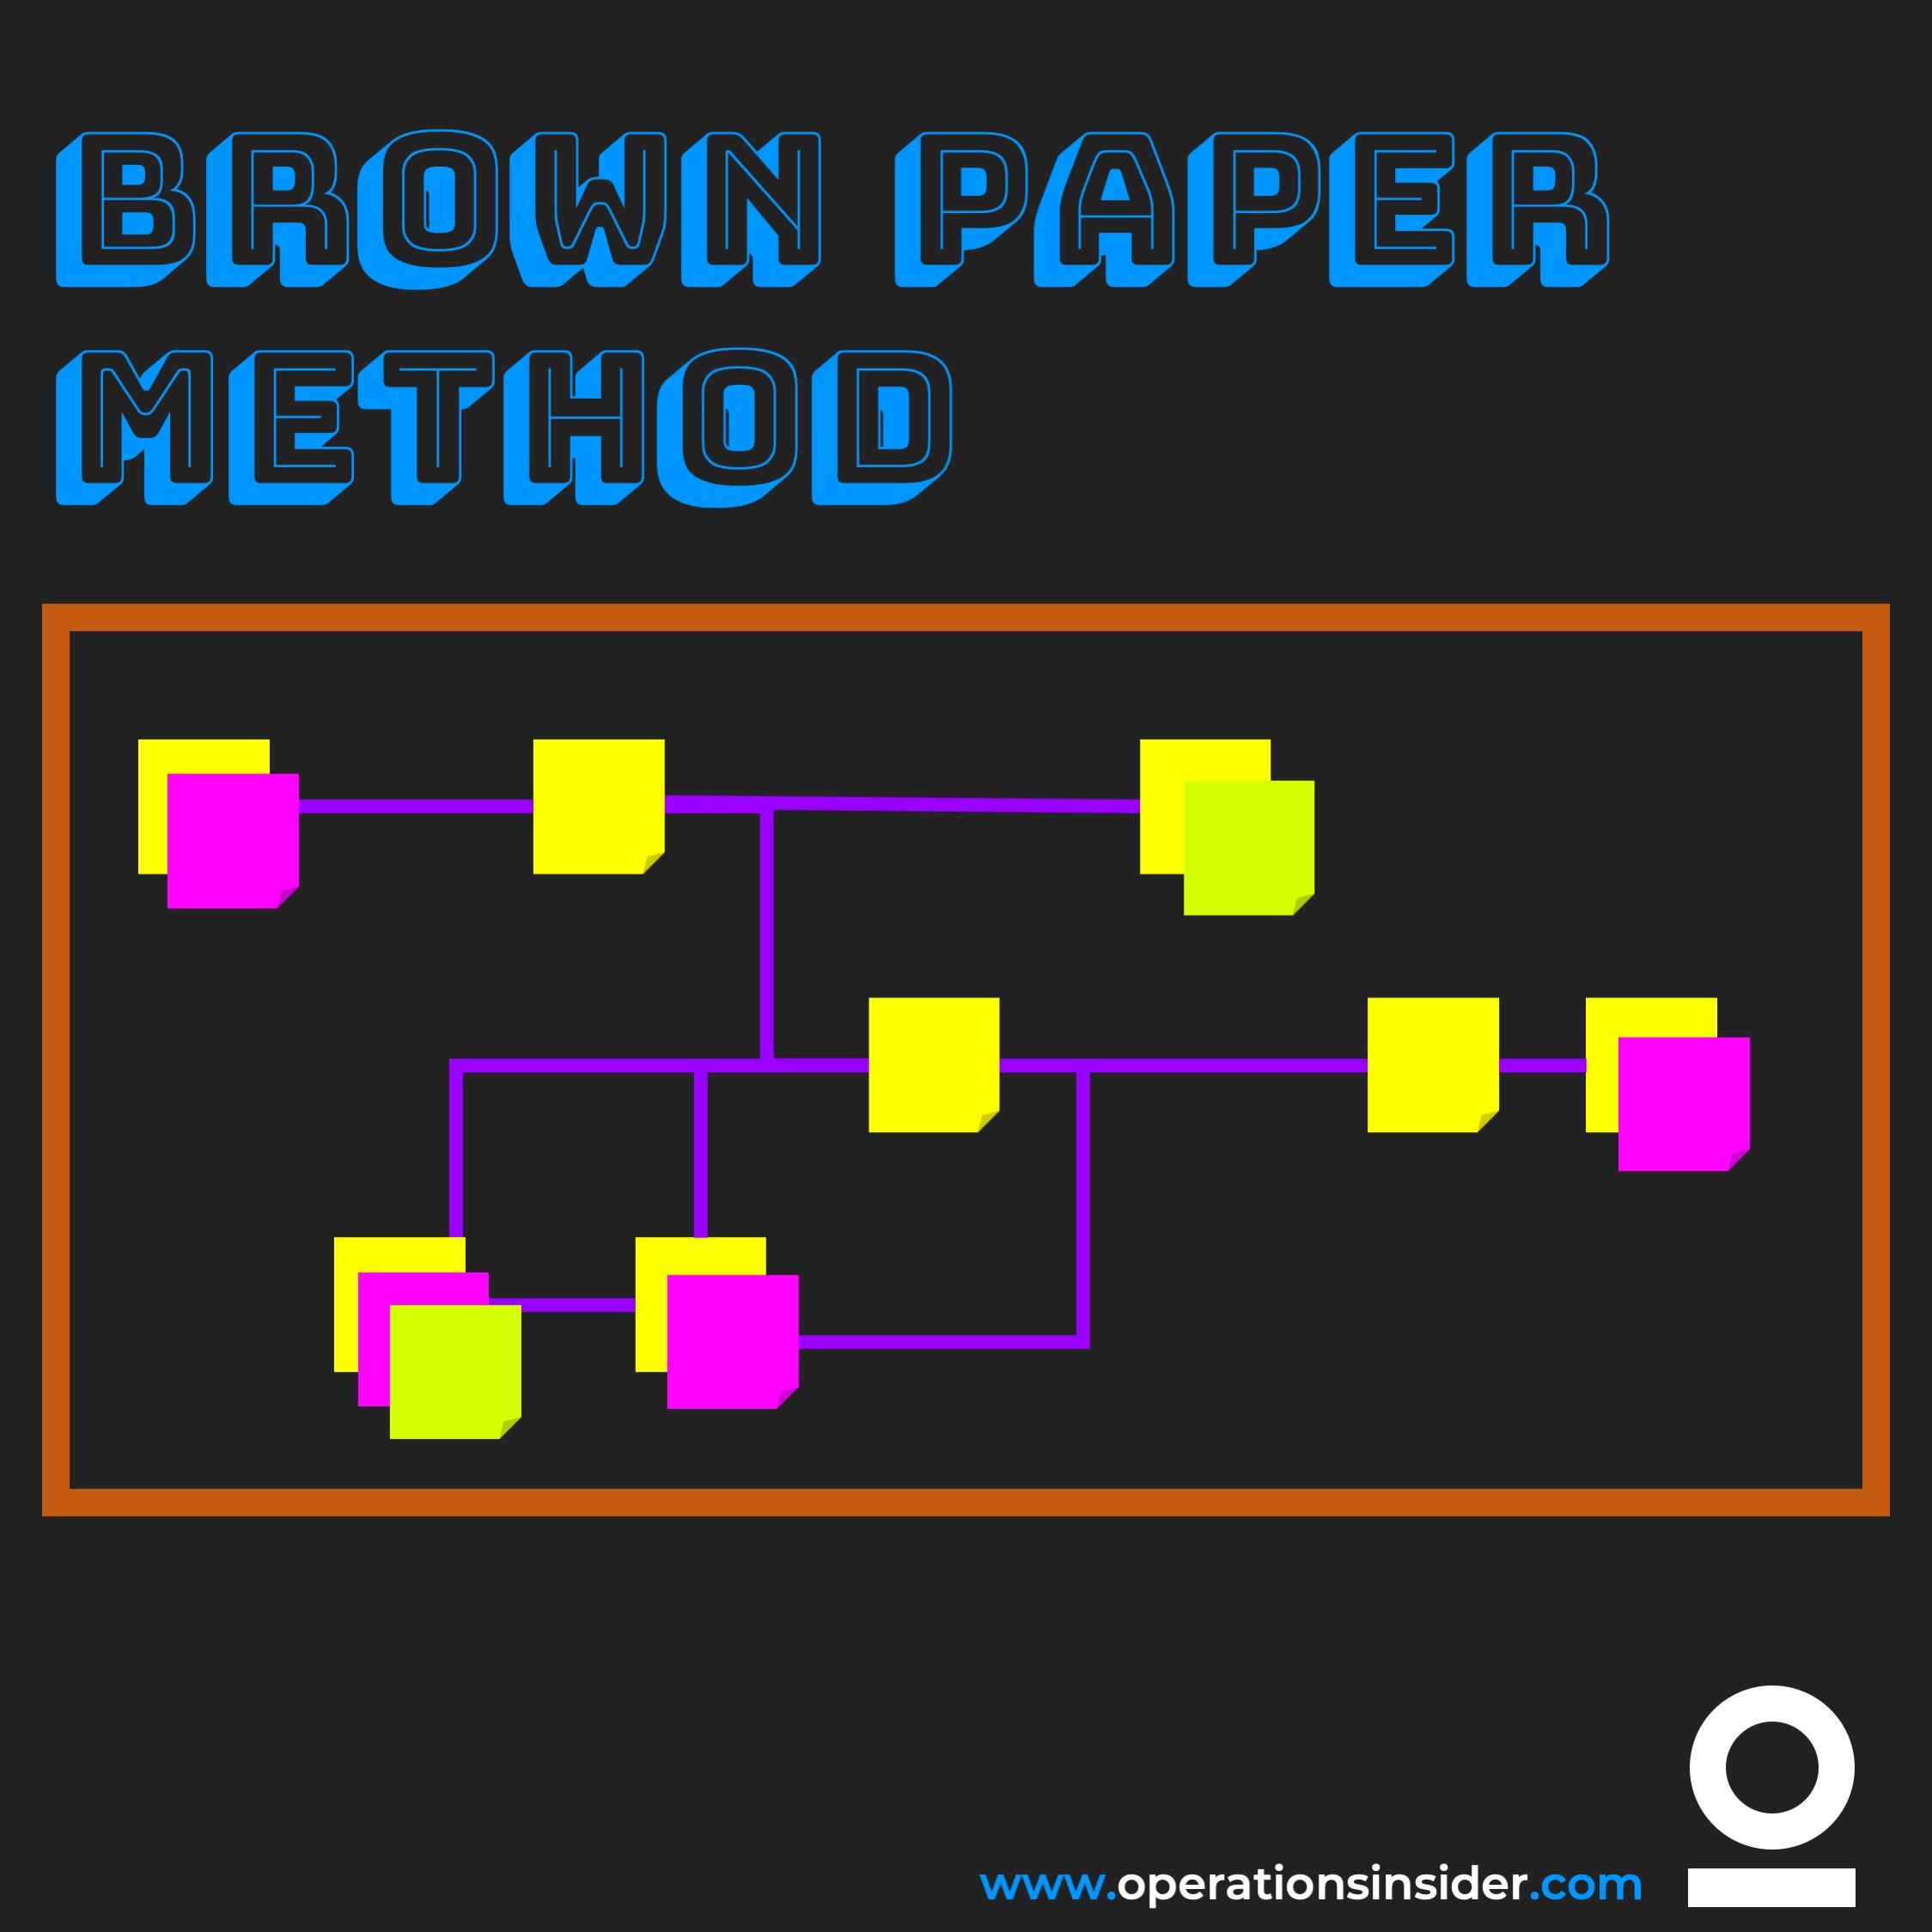
The Brown Paper Method is an easy to use tool for process development or management for your organization. During a workshop processes are drawn on a large piece of paper (typically from big brown paper roll sticked to a wall) and then analyzed.
Important: Draw the process as they really are not as you think the are. Do a Gemba Walk before this session.
So let us take it as a tool for process management. To be able to understand processes and procedures in your organization and to find out the weak points of them, it is depending on details. Getting those details can be tricky as they might be hidden in the process or in your employees minds and not always so obvious. As mentioned take the Gemba Walks and have a close look on the processes because it usually comes with a taste of complexity. With the Brown Paper Method you then have a simple tool to visualize the complexity in a simply way.
The Brown Paper Method is a pragmatic and result-oriented approach for process audits, presentations or analysis. It is based on a workshop where all involved persons of a process come together in person and collect their findings and doings on brown paper and draw the big picture of the process in total. Through the discussions, that will appear during the workshop, details will be pointed out that matter and defects or weakness will be described and visualized.
With the BPM, the actual process is collected, visualized and analyzed. Target processes can be also developed together. With the Big Picture of the process on brown paper all becomes clear for those involved and the tricky parts of the process are worked out and presented.
Based on the findings of the initial workshop the results are taken to the next level of process modeling. This includes the definition of the target process, implementation of automated workflows and process optimizations.
The process representation on the wall covered with brown paper can contain the following process characteristics:
What triggers and ends the process
Single process steps
Events
Suppliers and customers
KPIs can be important for the process flow (Defect rates, process times, etc.)
Process Input such as raw material, semi finished goods, pre-assemblies, toolings but also information and data such as reports or KPIs
Output and outcome such as finished goods or services
Employees actually executing process steps in the process flow
Employees that have an indirect influence on the process
Other teams or departments related to the process
and so on…
For the upcoming analysis following parts of the brown paper are discussed, additional information added and highlighted:
Critical activities that have a direct impact on the final result of the process including costs and time
Missing or missleading inputs such as information or defective parts
Wrong process steps that are distort the result
Incorrect or missing process step outputs
All potential to improve the process e.g. Kaizen activities marked with a KAIZEN flash
Which of these characteristics finally are listed in the process representation is up to the team as well as the weighting of each. This will then prioritize the potentials identified and when they will be tackled.

Lighthouse Project
When talking about Light House Projects this means nothing less than that a small sector of your organization e.g a department is already turned around.
When talking about Light House Projects this means nothing less than that a small sector of your organization e.g a department is already turned around. By that we are talking about living already the ideal state, that you defined for the complete organization.
Processes and structures can be seen as guidance for your organizations’ lean journey. It provides directions, shows what is possible and therefore is the kickstarter for a successful roll-out as people can convince themselves with their own eyes.
Just keep in mind that the lean journey with its process of continuous improvement is never over. The pioneer has to lead the way.

Continuous Improvement Process
The continuous improvement process is a method to continuously improve processes and procedures in companies or organizations.
Well known, not only in the lean world is the continuous improvement process (CIP). As it says it is a methodology to continuously improve your processes and procedures in your organization. In short = there is always something that can be improved. CIP is not only a saying it is a mindset and should be deeply anchored in your organizations DNA. Therefore it is a must to be lived and demanded by management as well as to be trained and implemented. As per definition the continuous improvement process has no ending it follows the cycle of PDCA over and over again. The basic principle behind CIP is to consistently observe and analyze your processes, take in consideration employees ideas for improvements, implement those and reassess the results if they are according to planned outcome.
Where das CIP come from: A short excursion in history.
In the 1950s, Japanese companies, best known Toyota, started to integrate the "KAIZEN" philosophy of life in operations. The Japanese word KAIZEN stands for "change for the better". To sum it up it means the continuous improvement process by small steps, every day. The ultimate target above all is to reach the highest customer satisfaction possible which guarantees economic success and is achieved by highest quality of goods and services. So they have to be constantly improved. Just think about the KANO - Model.
From the 1980s, European and American car manufacturer started to adopt the CIP methodology to increase their quality and by this their performance of finished goods.
Since the 1990s the CIP methodology made its way from the shop floor into the offices and has a straight impact on an organizations culture. With the so called PDCA cycle it is a never ending process and supports your whole organization on the path of sustainable growth.
Nowadays it is even part of the ISO9001 that defines the continuous improvement process as one of the "seven principles of quality management".
How to apply CIP
As discussed, CIP means improving through a consistent path of small following steps. Basic prerequisite is the ultimate will of your organization's management and the involvement and motivation of all employees in your organization. Focus on customer satisfaction > What is the customer willing to pay for? Everything that has no value for the customer must be seen as waste and has to be eliminated.
In real life organizations take the CIP approach to conduct regular audits by the Lean/Opex-Team. They analyze current issues or challenges and make suggestions for improvements. Typically the following approach can be seen as a rough guideline.
What should be improved?
Define the process, area or procedure
How should it be like and what is it like now? > Define the Delta
Numbers cracking > Go through the figures, actual and target state.
Describe the deviation or problem
What is the outcome by this deviation?
What are the costs of the deviation? Loss of quantity, rework, etc.
What is the root cause of the problem?
Analysis
What are the potential solutions?
Idea and Solution Mgmt. through teamwork and brainstorming sessions
What solution is the best?
Evaluation of the best solution defined
What measures need to be taken?
Cost-Benefit analysis
Results are presented to decision makers
Defined measures are adopted
Who does what, with whom and at what costs?
Measures are implemented
Verification of effectiveness through KPI tracking
If necessary re-evaluate measures to meet targeted outcome
You see, the methodology is very close related not to say a spin off the PDCA cycle.
The endless, repetitive PDCA cycle basically means permanently observing the processes, analyzing bottlenecks and weak points, develop solutions for improvements. To get a better understanding of PDCA read the article here.
In short:
Plan
Recognition of improvement potential, analysis of the current situation, development of improvement measures
Do
Implementation of defined measures
Check
Check the effectiveness of implemented measures with predefined KPIs
ACT
Constantly monitor and review the improvements through audits or reporting. When expected level of improvement is reached adjust the standardization to new level. If you failed on the expected outcome restart the PDCA cycle.
After the PDCA cycle is finished your area of improvement focus will change. E.g. your bottleneck process will move along the complete process.

True North
"True North" - a concept that plays a key role in the journey of lean management and the road of improvements.
"True North" - a concept that plays a key role in the journey of lean management and the road of improvements.
The principle of the true north goes back to the beginnings of the Toyota journey and means nothing less than the direction go for in order to reach real operational excellence.
True North defines the scope of your journey and the boundaries where you want to take your organization to the next level or where you want to have it. Some see it comparable as a mission statement or a reflection of purpose of your organization but for sure the foundation of your strategic planing.
You've got to be very careful if you don't know where you are going, because you might not get there.
Yogi Berra
Make sure that you understand that depending on your perspective the True North can be for everyone different based on their point of view. But in Lean Management or Operational Excellence with True North you define a specific set of ideals that are providing a compass for your organizational change. No matter if you talk about strategy, processes, culture or geographical challenges.
With the help of the True North principle it is clear to what you should do and not what you can do. In the Lean World you might have heard about the term of the Ideal State the Ideal State defines a state of perfection in your complete organization. Thinking about processes - a process is then as simple as possible when you can’t take anything more off it. This is state you are aiming for.
The continuous improvement process has no end, and you will constantly drive the PDCA cycle over and over again - only the starting point shifts to the next level.
But no matter what, it is like sailing on the ocean, without navigation you won’t reach the shore. The ironic part of it: you will never reach the shore - speaking of being done improving. True North is a way of running your organization not some final defined target state. It describes your daily practice of beating yesterday.
Target Agreement
A Target Agreement is a management technique where employees and management together reach an agreement on how achieve the organization’s targets.
A Target Agreement is a management technique where employees and management together reach an agreement on how to achieve the organization’s targets. It thereby consists of two key elements:
The TARGET
and the ACTIONS
Targeted state including the measures taken to achieve the set targets. Think about KPIs - a combination of quantitative measurable targets and an action plan following the PDCA.

Key Performance Indicator
A method of tracking or monitoring the progress of existing daily management systems.
Key Performance Indicators are measurements utilized to indicate the performance level or progress with regard to important objectives or defined success factors within your organization. To make it short KPIs are used to track or monitor the progress of your existing daily management system.
So how do measure our progress of our organization? How can we define what type of indicators we should use and what they tell us about the current state of our processes? And so on…
These are just some questions that might rise when thinking about implementing KPIs in order to better understand your organization and define a path to go for improvements. What processes are truly adding value to the final product or service the customer is willing to pay for and what is just waste?
Before you start implementing KPIs in your organization a helpful way is to categorize KPIs in two ways: leading and lagging indicators.
Leading Indicators
Leading Indicators are Performance Indicators that are tracking your process. So these are real time figures showing you deviation to given standard or if there is something missing in order to produce your goods or services. They have a real time effect on your delivery performance. The fun part with leading indicators is that you have real time results why it can also take months for a report showing how your organization is doing in general.
For example, talking about injuries, when an operator is involved in an accident during a process step. This incident will be documented on an incident rate report of the organization, for e.g. factory. So when you think about it you recorded an incident after it happened. This is a necessary process in the majority of organizations due to governmental regulations and safety laws. The question to ask is now what do you do with this information? Do you really know what caused it? The information is quite old. This is why the incident report is not a leading indicator but a lagging indicator.
Lagging Indicators
As just mentioned Lagging Indicators are result-oriented, because of this they are shown after something happened. With lagging indicators you react after an amount of time as you are reacting on something that is already in the past. Coming from automotive this is typically a customer claim in the field, you will have a lot of work to do to find out what actually caused the failure, if no proper traceability is installed. Attention: With those failures it is often miss leading that through assumptions symptoms are fight that are not real. Everybody from Task Force Managers to shop floor firefighters knows that. In this case you are not adding any value nor do you implement a sustainable solution.
Having this two categories in mind we can say that the majority of KPIs are lagging indicators. This is not only in the field of manufacturing. The most miss leading assumption thereby is that with Lagging Indicators we get the most information.
But openly asking - isn’t it better to prevent the accident before it happens? This is absolutely speaking for Leading Indicators - and by focusing on Leading Indicators your focus in daily operation will shift to your process and not the overall outcome. In fact: when focusing on improving your process as a side effect the overall outcome will increase automatically.
Where to start with KPIs?
First things first - don’t overdo it!
Start to ask yourself what is your daily business? What processes are constantly and repetitive in use? The same principle with Gemba Walks go to your employees and talk to them - ask what is doing well and what not. What can improve their work?
The situation can be daily checked with line reviews or the so called meeting cascade. Where on the lowest level with the shift hand over performance KPIs are reported and issues during the shift are addressed. This figures are then visualized on the e.g. “Cell Board” near the outline of the cell itself. Typically if you have an U-Shape Layout at the spot of raw material and finished goods.
If something goes wrong latest after one shift the focus will be on this process. This automatically prevents new incidents from having a threatening impact. This is the advantage from getting things done right away or afterwards when the game is already over.
Finally to bring it in a nutshell, try to bring your KPIs from lagging into leading. This will shift the focus on the whole organization towards daily processes and improving them with the help of daily Kaizen activities. Measuring the process constantly in real time gives you the opportunity analyze trends and adjust processes to be ahead of the game instead of being surprised by the market.
Analyze your data existing decide what to go for. Implement your KPIs and make sure they go hand in hand with a meeting cascade. This ensures the consistency of data used and that they are actually used to trigger actions. Based on the KPIs you will be able to drive focused improvement actions through shop floor management, visual management, standardized work and structured problem solving.

Visual Management
How visual management can help you to keep the overview of your operations.
Hej there! Great to have you back! In this article we want to show how visual management can help you to keep track in daily operations.
Generally speaking Lean Management can be seen as a clearly organized workflow that defines the way your organization should work following given principles. Above all principles existing lies to avoid waste in any kind following the 5S Principle as foundation: 1 Sort out 2 Set in order 3 Shine 4 Standardize 5 Sustain.

For a clear visualization of running process in your organization, cleanliness and orderliness is the main part of it. Clarity of your processes on the shop floor is the foundation for all lean manufacturing activities. Having the clarity the implementation and maintaining of visual management methods will guide you to a real state of flow.
In the following we want to describe key basic visual management elements that every production, following the lean principles, should have.
Boards, Notes, Infographics, Brochures and even Movies
Don’t panic and try to explain all those Japanese words it works well without being too technical. Many instruments of the Lean Manufacturing Methodology are very useful to raise the awareness of your employees about lean management. Once implemented and continuously driven by the management the incentives are there to drive daily improvement measures.
The target with visual management and those methods are all the same:
Create transparency
Visual representation of procedures processes and services
Making problems (or bottlenecks) visible
Kanban Boards
Kanban can be literally translated as “card” in the context of a production system. No matter what processes you have, it all starts with a customer’s order. The Kanban card is then used to inform upstream processes about the need of materials, pre-assemblies or process steps. This automatically leads to a cycle that triggers itself through the complete value creation chain.
This is the so called pull principle the advantage if this principle is that, in best case, you have no work in progress which means you have no stock of semi finished goods built up, because only what the following process steps need is produced.
A3 Reports
The term A3 Report comes simply from the size of paper which is used for the documentation of the report. The structure itself follows the PDCA methodology.
The A3 Report is the representation of a problem to be solved. In this case the responsible person from the quality department takes the A3 Report, starts the problem solving actions and follows a systematic structure that makes it possible to describe the effects that are currently leading to a deviation from the standard. Using the A3 only makes sense when you don’t know the root cause yet. If you already know the root cause don’t waste your time. Fix it and go back to normal.
Andon: Lean management with boards and ripcords.
Andon again a Japanese word meaning “lantern”, at least in the context with lean manufacturing. It is a visual aid that is there to draw attention to problems on the shop floor when machines or processes are causing defects or simply stop working.
You might think you have seen them all by walking through production and seeing all those PLC signal lamps indicating green or red, but there is so much more. Just have a look at the Andon article.
Just want to name administration, maybe there is nothing to indicate, but when you think about a document that is needed in a different department, waiting for this is one of the TIMWOODS MUDA. The time waiting is probably the best indicator to start with lean admin activities.
Andon Cords - Please pull the rip cord in an emergency!
Andon Cords are rip cords or a simple button straight at the operation on the shop floor that gives the operator in the process the possibility to instantly stop the line when problems or defects occur.
Andon Boards
Andon Boards are displays or nowadays mainly TV screens that are showing the actual status of the manufacturing line e.g. PPM, down times, etc. Typically it is automatically feeded by the machineries of the production line. With the standard defined color indication everyone sees if they are doing great or not so great. In the second case an automated alert to supervisors or maintenance is triggered.
You see there are many possibilities, but the target is always the same. One hint at the end: Make your boards, infographics or brochures as simple as possible! (or just use mine ;))
WHY? As with processes > it is only a good process when you can’t cut anything more away from it. In other words: What is the value you get from something that nobody understands?
If you take the principle of visual management seriously it will help you to bring all processes in your organization to live.

Set up time reduction
Set up time reduction. Nice and simple.
First things first. In order to reduce set-up time the set-up process itself must be observed and analyzed (e.g. by using the EMIPS - eliminate, minimize, integrate, parallelize or synchronize - methodology).
After you have analyzed the process make sure you write down all identified kinds of waste. Try to define the ideal state of the new procedure. Only after verification through testing of the new procedure make it a standard and implement it in your TPM framework. By doing so your operators are now responsible for the new set-up procedure, assumed that your operators are properly trained.
The whole focus on set-up time reduction comes from the customer requirements to manufacture a higher variety of goods in smaller batches. In order to meet those requirements set-up or change over must be kept as short as possible.
But let us go a little bit more into the details.
The pure set-up time is defined as the time needed to change from the last part of a batch to the first part of the following batch.
The set-up includes all activities needed, preparation, action on side and adjustments needed. By doing this you automatically differentiate between so called “external” and “internal” activities.
The following steps should help you to make it easier to reduce set-up times
1 Classify each part of the set-up process to either internal or external. Internal steps are those that only can be done while the production is or has to be inactive. External steps are done without interrupting production.
2 Convert internal steps to external ones. The whole idea is to minimize the time needed shutting down operations. This is why we want to take internal steps out as much as possible.
3 Reduce the time needed for the remaining internal steps. There are for sure some steps you can not take out, for those the manufacturing has to be stopped. The whole focus is now on this internal steps and how to reduce them to an absolute minimum. Here the SMED methodology (Single Minute Exchange of a Die) can help. Too find out more you can read here.
4 Eliminate adjustments. Last but not least try to get stable process parameters. With effective process control in place you can get rid off adjustment activities.
A Pareto Diagram can be useful to prioritize the setup time reduction activities. Don’t start everywhere at the same time! Start with the biggest loss and you will see over the time how it will change. It also gives you a great opportunity to see the progress that you are making on set-up time reduction.

DMAIC
Define, Measure, Analyze, Improve, Control. DMAIC is an incremental process improvement using Six Sigma methodology.
Define, Measure, Analyze, Improve, Control. Incremental process improvement using Six Sigma methodology.
DMAIC can bee seen as a data-driven improvement strategy and for sure is part, or will be a part, of your organizations SIX SIGMA quality initiative. DMAIC is an acronym for: Define, Measure, Analyze, Improve, and Control.
DMAIC is a cyclical process such as the PDCA is. The reason to go for the DMAIC is to strive for the best result possible with a structured approach.
These process steps are:
DEFINE: the customers and their CTQ (Critical to Quality) and the core process involved.
Who are your customers?
What are their requirements for products or services?
What are their expectations?
Go for a value stream and map the process flow through the complete business process
MEASURE:
Define a plan on how to collect data from your core process
Go for different sources of data in order to be as specific as possible on defects and metrics
ANALYZE:
While analyzing the data along the process map make sure to identify the real root cause of defects and
point out opportunities for improvement
Compare shortfalls with the results of customer surveys
Determine gaps between targeted performance and current performance
Prioritize potential improvement measures
Identify variation and their source
IMPROVE:
Kaizen Workshops
Target is to improve the current process in a simple and effective way
Develop a prioritized action plan
Do it!
If you want a structured approach, just read our PDCA article.
CONTROL:
Stay tuned on your process improvement measures
Make sure that they stay on track
Prevent falling back to the “old way”
In the end, when you are in charge, require the full documentation. Make sure that everything implemented is well documented and a clear monitoring is installed that deviation can be fast identified.
Having or installing a sustainable problem solving culture in your organization will be key for the future. Make sure to institutionalize problem solving or a kaizen culture through training, training and more training.

Turtle Analysis
“Turtle Diagrams” are an effective tool to understand the processes from both a managerial and workforce perspective.
Turtle Diagrams are an effective method to understand the processes from both a managerial and workforce perspective. These diagrams can also be used to identify gaps in the organizations structure and further develop organizational procedures. From these activities further measures can also be developed for efficiency improvement.
How to use Turtle Diagrams
We will go through the diagram step by step:
INPUT:
Enter details of actual process inputs such as raw material, requirements, information, documents, etc.
PROCESS:
Enter your management process.
OUTPUTS:
Enter your expected or defined output of your process. This can be finished goods, products, records, documentation, etc.
CONGARTS you already described your main process. Now we will complete it with details.
WITH WHAT:
This is asking for materials and equipment. Enter details of materials, components, machinery, test equipment, software, etc. all you use in the process.
WITH WHO:
Resources and competencies. Enter human resources requirements, including qualification, competencies and training requirements or restrictions.
HOW:
The how goes for the supportive processes, procedures and methods. Write down linked processes, pre-processes, supportive processes, instructions, procedures, standard work described, etc.
WHAT FOR:
Key Performance Indicators. Enter the targets, KPIs, performance measures, etc. to measure effectiveness and efficiencies.
Example of a Turtle Diagram
How to use the Turtle Diagram for auditing
When running an internal audit, you can use the Turtle Diagram to understand the relation between input and output for the audited process or activity. In order to get full advantage of the audit, the auditor needs to assess not only the process itself but also the complete surrounding such as the process owner, stakeholders of the process, standard work procedures, training and qualification matrix of persons involved, as well as linked processes. Based on the Turtle Diagram Layout the auditor has a guide to follow through the process audit.
Running the Turtle Analysis
When talking about quality management, process analysis is a key part of daily business. With the Turtle Analysis and the resulting Turtle Diagram you will have the chance to describe processes in a simple and clear one pager. The summary of this one pager is the description of the most important process characteristics. This overview can then be taken to identify risks and weaknesses of the process and build the framework for upcoming quality audits.
The Turtle Diagram gives a clear picture of the links between two process steps or different processes. As usual in manufacturing environment the output of one process step is the input of the other. This can be made visible with the the Turtle Analysis. You starting point is then when interfaces do not run smooth or e.g. important information is lost during hand over phase.
In addition after a Turtle Analysis or audit with the diagram and identified risks and weaknesses you can define specific objectives to be addressed. As mentioned above you can steer and control your improvement actions with pre-defined KPIs, this helps you to visualize deviations from the set course easier.
If you think you need a deep dive on one specific topic found during the Turtle Analysis, we recommend the ISHIKAWA or the 5Why methodology.

Waste
The opposite of value creating are non-value adding activities. Those can be remembered with TIMWOOD.
Waste (MUDA)
Waste or MUDA is the opposite of value creation. Waste describes all non-value-adding activities the customers are not willing to pay for. The two main categories are obvious and hidden waste. While obvious waste can be eliminated, hidden waste can only be minimized.
When talking about waste there is no way around the 7 kinds of waste according to Taiichi Ohno most known in the lean world as TIMWOOD. Feel free to read the complete article on TIMWOOD(S) - yes you are right - where is this S coming from… keep on reading and you will see.
The 7(8) kinds of waste:
T = Transportation
I = Inventory
M = Motion
W = Waiting
O = Overproduction
O = Overprocessing or - engineering
D = Defects
S = Unutilized stuff
It is important to be aware of these kinds of waste in the list. But overproduction is the worst and typically initiates the other types of waste.
To read more in detail about TIMWOOD go here.

Pareto Principle
The 80/20 rule demonstrates that things have an unequal distribution. Out of 5 one will fly and have the most impact. With 20 percent of action 80 percent of your target state is already reached.
The Pareto Principle describes that 80% of problems can be closed with 20% of the causes. This principle is named after Vilfredo Pareto who found out that 80% of Italy’s wealth belonged to 20% of the population.
With this in mind it is worth to have a look at it.
Let us start with an assumption, according to the Pareto Principle it allows us to assume that
20% of input creates 80% of the output
20% of customers create 80% of your revenue
20% of causes create 80% of failures
20% of your employees create 80% of sales
and so on…
But before you run away now and think you have the answer hold a second. With the 80/20 rule you might tend to say that it always have to be 100 - it’s not. Make a deep analysis before making such statements! 20% of your employees can also make only 20% of sales or 60%. So before you fire 80% of your employees keep in mind that the Pareto Principle only gives you an idea on the distribution.
The whole idea behind it is that most things in life are not distributed evenly!
When we talk about value adding activities and the final product is 100% What is with all the necessary tasks, that are not adding any value to the final product but have to be done to run the company.
Or think about failures and finding the root cause, where to start to take actions? This is great when you think about a Failure Pareto and you want to satisfy your customer as quick as possible. Of course you are focusing first on the most failures and most of the time - not always - the other failures will disappear as well.
But most important of all, your customer gains trust in you that you have the competencies to do the job.
The key point is that most things are not in a 1/1 actio = reactio relationship.
So what can we use it for this 80/20 rule?
The Pareto Principle in first place supports you on realizing that most of the outcome are based on a minority of inputs. This means:
20% of input creates 80% of the output > try to reduce those non value adding activities
20% of customers create 80% of your revenue > install a key account manager that the customers knows he/she is important to your company > your customers success is your companies success
20% of causes create 80% of failures > Focus on fixing those failures first
20% of your employees create 80% of sales > get those employees a reward
We could continue on and on. To bring it to the point > focus on the 20% and not on everything at the same time.
Some examples that might help you for a better understanding:
Instead of spending a whole night to prepare a presentation and thinking about where to start > focus on one topic and do it. You will get a feedback anyway during the pitch. This feedback gives you the chance to take it and improve it.
Instead of focusing on one solution that might be the best and go through all the details. Make a list of three and go through the pros and cons with your colleagues that probably know the topic better anyway and based on their opinion make a decision with what to go on.
Maybe this examples are nuts for you but we want to emphasize that you should focus only on the important 20% and forget - for the moment - the other 80.
Last but not least - the Pareto Principle is not a law of nature it is a guideline to steer your focus and to save time on problem solving or simply getting your job done faster.

FMEA
The method of the FMEA - Failure Mode and Effect Analysis has been used for years in the automotive and manufacturing industry.
Failure Mode Effects Analysis - FMEA
The method of the FMEA - Failure Mode and Effect Analysis has been used for years in the automotive and manufacturing industry.
The risk analysis framework has been applied in a wide range of industrial sectors. The first areas of application were traditionally in product development. Based on this the integration of the production process planning and the production. In the automotive industry, the joint creation of FMEA for products and processes by Today customer, supplier and subcontractor are a natural part of a cooperation.
The user is guided through the "10 Steps to Creation of the FMEA".
Step 1 - Review the process
Use a process flow chart or an already existing value stream map to identify each part of a process
List all process steps in a FMEA table
If you think the list gets too long it might is. Use this chance to split up the process and cut the elephant. It makes more sense to work on smaller parts of the process instead of getting lost in the woods.
Step 2 - List potential failures
Review all existing data and documents that can give you a hint about each component that can lead to a failure
After having a complete list try to cut it down and to combine the parts of the initial list
The chances are high that you will identify several potential risks of failures for each component
Step 3 - List potential effects of failures
The effect is the outcome of a failure on the finished good or a process step
It is common that not only one effect will occur for a single failure, don’t be suprised
Step 4 - Assign the level of failure to risks
This is based on the consequences for each failure
Think about the ranking as the worst impact that it can have
Step 5 - Assign the possibility of occurrence
How high is the possibility of occurrence
What impact will it have if occur
Step 6 - How can it be detected
What are the chances that you will detect the failure before occurring
Step 7 - Calculate the RPN (Risk Priority Number)
Severity (S)
Severity x Occurence (S x O) = criticality
Severity x Occurence x Detection (S x O x D) = RPN
Step 8 - Define the action plan
With the decision making process followed by the prioritization from the RPN (Step 7) focus on the topics with the highest RPNs
Follow a classic action plan by defining who will be doing what till when
Step 9 - Take action
Get things done!
Implement the defined improvement actions
Follow the PDCA principle
Plan - done
Do - right now
Check - Step 10
Act - loop starts over
Step 10 - Re-evaluate the RPN
Time to check on the impact of your actions
Re-evaluate each potential failure identified and determine if the improvement measures have an effect or not
If not follow the PDCA and start over with step 8
The FMEA is linked to all CIP and Kaizen activities - there is always something to improve.
Root Cause
The ultimate reason for an event or condition.
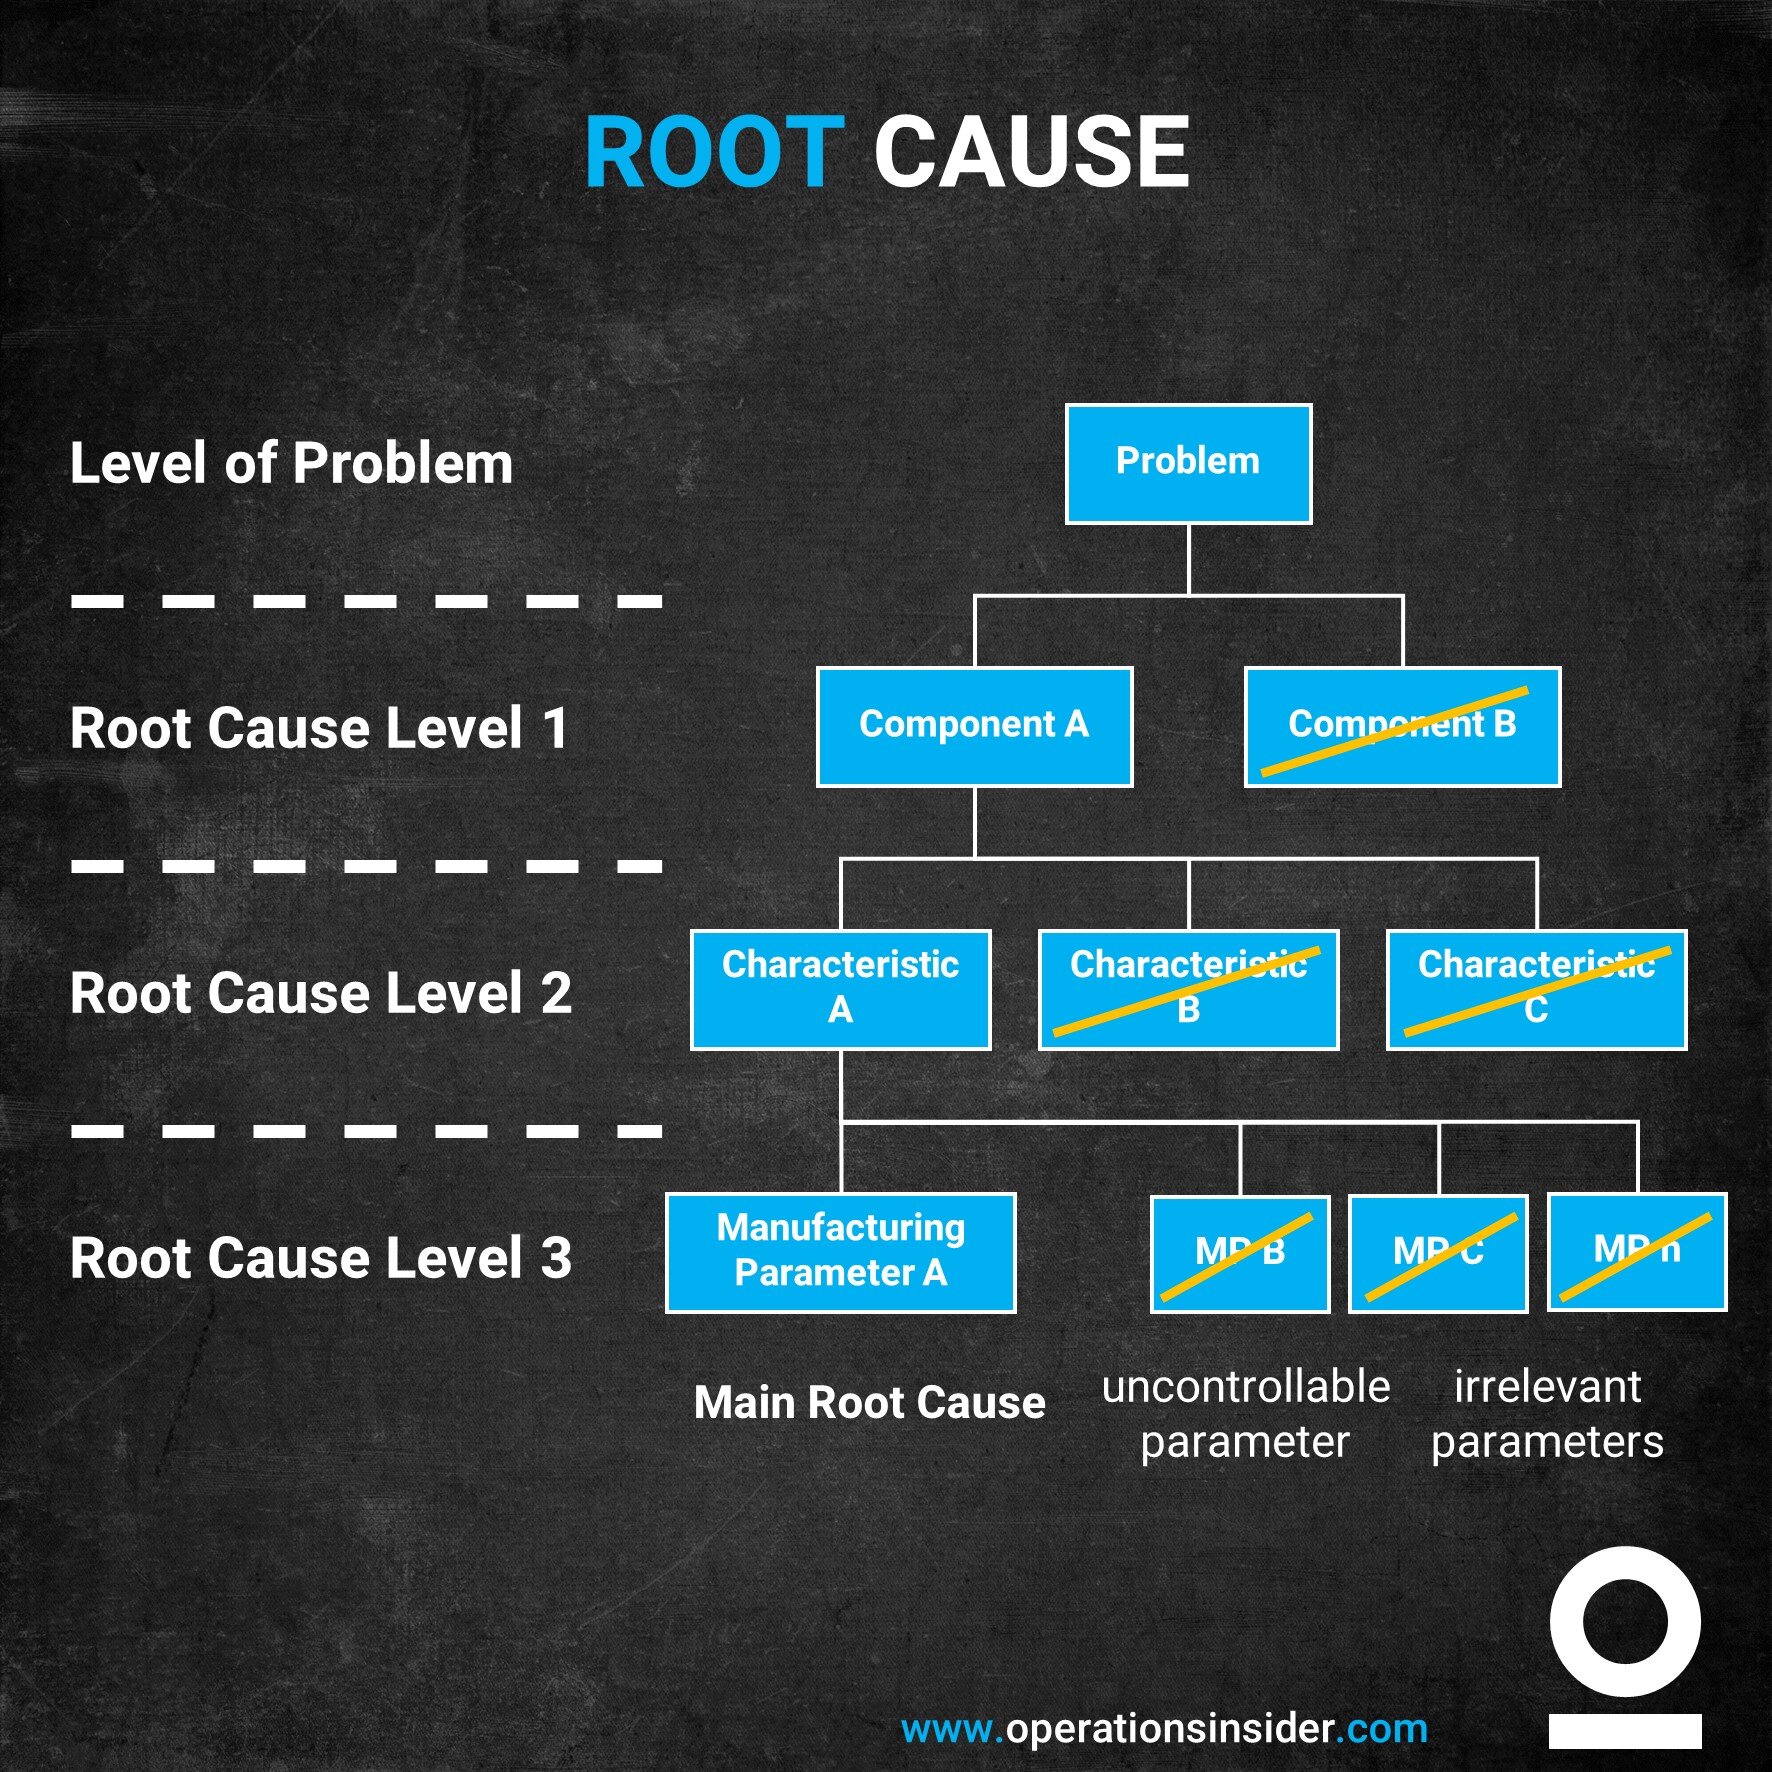
The Root Cause Analysis brings you to the ultimate reason for an event or condition
Methods used in the root cause analysis help you to identify the actual causes of defects or problems in your goods or processes. The whole idea behind a root cause analysis is to understand and get rid of the source of the problems and not to fight the symptoms. Thinking about quality management the Root Cause Analysis is a big part of it and has an impact on Six Sigma and 8D processes.
The root cause analysis is in demand when problems can no longer be solved with pure empirical knowledge (e.g. known products are used in new operating conditions and cause problems there).
The basic idea of all Root Cause Analysis methods is first of all to describe the problem (symptom) as precisely as possible, to limit the potential sources of the problem and then to systematically follow the error path. A distinction has to be made between purely theoretical analyses and experimental root cause analysis.
Known theoretical methods are the 5-Why question technique and the 6M method (Ishikawa). These methods, however, often suffer from the limitation to consider complex problems insufficiently. For example, it is impossible to identify combined root causes.
For complex problems, Vester's system analysis shows very good results in practice. Using the so-called intensity relationship matrix, expert knowledge is systematized and thus contributes to new approaches.
The area of root cause analysis also includes experimental designs that have the goal of eliminating a problem. A distinction must be made here between problems resulting from the production and assembly process and those resulting directly from the components or combinations of components. One of the well-known methods in this area is the component exchange methodology, which represents a methodically and statistically proven way of eliminating problems caused by components.
Apply Root Cause Analysis methods to your quality problem.
6M methodology (Ishikawa)
Vester` intensity relation matrix
Problem identification and identification through statistical product analysis in ongoing production through a practically established multi-stage problem-solving approach.
Root Cause Analysis

Ergonomic Workplace
A work place that takes into consideration most of the ergonomic aspects such as the operator’s height, range and reach.
An ergonomic workplace is a work system that considers the ergonomic aspects of an operation and the operator such as the operator’s hight, range and reach with the goal that the operator does not need to bend or turn.
The ergonomic workplace goes hand in hand with the work improvement.
Definition and purpose
Reveal waste increasing cost and not adding value.
Find waste in the movement of workers, eliminate/improve, pursue net work adding value.
Worker Movement
Lean Manufacturing and Ergonomics may have different roots and directions but together they can complement each other and define a more efficient and safer workplace.
One of the best person known for focusing on productivity and efficiency in manufacturing processes was Henry Ford with the invention of the modern assembly line. Ford really was focusing on eliminating waste and to cut down unnecessary costs in relation to the manufacturing of his cars.
Toyota is one of the best known companies that has stretched to the maximum the idea of Lean Manufacturing and is now holding the pole position when it comes to the reputation according the elimination of “waste”.
By looking at the Lean Model as well as Work Ergonomics, you clearly see the necessity of both practices in the industrial workplace, as well as observe that both can complement each other.
The 7 types of waste to eliminate include:
Transport
Inventory
Motion/Movement
Waiting
Overproduction
Overprocessing
Defects
The list of TIMWOOD is what Toyota has defined as the seven major types of wastes or non-value-adding activities. The seven wastes do not add any value to the product and the customer in the end is not willing to pay for it. Therefore it is essential to remove as much waste as possible which will have also an effect on the ergonomic workplace and furthermore on the health of the operators.
Some of these things like transport, waiting or unnecessary movement can be reduced to a limit what the operator still needs because as human being the operator is limited by his body.
The Lean Manufacturing initiatives and workplace ergonomics stepped into the manufacturing world at different times and therefore are not fully integrated. But you are perfectly advised by combining the principles of Workplace Ergonomics with Lean Manufacturing initiatives. Through a cooperative assessment and teamwork you have the chance to complement each other in making the workplace more efficient and a safer place.

Blue Ocean Strategy
Blue Ocean Strategy: Innovation to develop new markets.
Innovation for New Markets
The blue ocean strategy leads out of the shark tank: instead of copying the competition, companies find new markets.
Blue Ocean strategy: Off to new markets
Which company does not dream of an untouched market? And how many companies are stuck in the constant, sometimes ruinous competition and are treading on the spot? In order to escape this fierce struggle for survival, a rethink is necessary: If your own market or the market you are aiming for is too fiercely contested, you create a new one.
Opening up new markets is the core idea behind the so called Blue Ocean Strategy. To explain it simple the Red Ocean stands for existing markets where the sea is full of blood and therefore red, the Blue Ocean is the untouched, sweet spot of sea where nobody was before you.
I think we don’t have to discuss the obvious advantages of an untouched market. At least in the beginning you won’t have any competition. Your organization can act instead of react which automatically gives you higher turnovers and returns. But it is for sure not risk free, failure can get you everywhere. And even worse you will swim all by yourself not finding any customer and starve to death or die of thirst.
Customer Centric Focus
The Blue Ocean Strategy comes with several tools with which your organization can create new business cases. What they all have in common, is the focus on the customer benefit, regardless on the how to sail the blue ocean. Just think about technological innovation.. typically driven by making the customer lives more comfy.
Analyze and reposition your offer
The Blue Ocean Strategy first starts by analyzing your existing offer, which has to be done from the customer perspective. This is followed by the competitors analysis, what do they have that customers buy their products instead of ours, what is the extra value? The outcome is then recorded in a so called value curve.
The next step is the usage of the so called ERIC square. A typical tool to redesign service offers of drive product developments. The Blue Ocean gets a shape.
The E stands for Eliminate: What existing features are obsolete for the new use case?
The R means Reduction: What is important for the customer but can be reduced to an absolute minimum without being kicked out?
I for increase: What product features should be raised above the existing standard?
And finally C for Creativity: What awesome features does the customers want but don’t know yet?
A slightly different approach can also be the use of the Osborn Checklist, but won’t be covered in this article.
Creating Blue Oceans
Let’s face it, you can have the best product in the world, but without a market it is worthless. This already indicates the crucial factor of success of a blue ocean strategy, e.g. creating new markets or at least expand the existing one. To help you getting to new markets six paths can be taken:
Are there existing strategic groups in the industry?
Are alternative fields of operation possible - and if so, which ones?
Is there a potential target group that has been ignored so far?
What are the new mega trends that others haven’t recognized yet?
Are there complementary services or goods that nobody has on the radar?
What functional or emotional motives would customers want to buy the new product from?
Following these questions already shows you that the Blue Ocean Strategy rarely ends up in a completely new and disruptive product. The reality is that different product features are combined and given out to the market as new release. That is for sure not the idea behind the Blue Ocean Strategy, but used for it. The benefit of the Blue Ocean Strategy is to turn non-customers into customers. These folks are your blue ocean.
Have a look on Show Stoppers
Like with all theories, the Blue Ocean Strategy seams quite simple. But no matter what and how you do it, make sure to have a clear and transparent communication throughout your organization. Everybody has to be on board and support the planned journey, otherwise chances of getting stuck at the harbor and not setting sail are quite high.
And finally, when set goals or targets think about SMART, most important > it has to be realistic - can’t say this often enough.
Checklist: Blue Ocean Strategy
In summary, the following aspects must be taken into account in the Blue Ocean Strategy:
A saturated market with predatory competition does not permit growth.
A new, unrivaled market is created through beneficial innovation.
The existing offer is analyzed from the customer's point of view.
A new range of services or features is created.
Employees in the own company are involved in the implementation.

SMART - OBJECTIVES
SMART - Objectives drive us forward and continually remind us of what we want to achieve. They help us to set priorities more clearly, to focus better and give us the strength to continue, even if our motivation is low.
Goals are helpful both in our daily work and in our personal lives, as they give us something to work for.
SMART - Objectives drive us forward and continually remind us of what we want to achieve. They help us to set priorities more clearly, to focus better and give us the strength to continue.
HOW TO DEFINE GOALS
Objectives can be manifold, but one of the best known methods to describe goals is the S.M.A.R.T. methodology. The 5 steps can be used to clearly describe a goal and make it "tangible".
The acronym SMART stands for the following 5 steps:
S - specific | Clearly defined goals
M - measurable | The target should be measurable (has a KPI)
A - accepted | The accessibility of the goal should be accepted by all stakeholders (alternative: ambitious/attractive)
R - realistic | The attainability of the goal within the set framework should be realistic,
T - terminated | The time of target achievement is clearly defined.
FURTHER DEVELOPMENT, SMART BECOMES SMARTER
Some of the terms have changed over time. So the A at the beginning stood for agreed upon. This is from the thinking that the term is used within a company. In this respect, it was important that a goal was accepted by all involved. Over time "agreed upon" often became "achievable" or "attainable".
Not only the terms themselves have changed. The acronym itself has often changed recently. Many authors have switched to making SMART - SMARTER.
The E stands for "evaluated".
The R stands for "reviewed."

More than 200 pages about OKR may seem like a stretch – and there is a bit of extraneous material – but those who must lead an OKR initiative, especially novices, will value this substantive guidance.
Read the pick here.
In my opinion, the popularity of SMART goals stems from the simplicity of the method and the higher probability of success. Why should it be higher? Now the SMART method requires from the person or department that set the goals a certain time and focus on those goals. When one is so intensively involved with defining goals, one inevitably thinks of ways in which the goal could be achieved. Furthermore, one has already taken the first step and is now more motivated to take the next necessary steps.
Of course these steps must not be missing. Action plans must be derived from the goals, whose degree of goal achievement should be regularly reviewed. Regular monitoring of progress enables me to adjust my next actions to the achievement of my goals.

PDCA
The idea behind the PDCA cycle is to empower employees to independently identify and solve problems. It is also a crucial element of the continuous improvement process (CIP).
The idea behind the PDCA cycle is to empower employees to independently identify and solve problems. It is also a crucial element of the continuous improvement process (CIP).
Many projects in which a culture of continuous improvement (CIP) is to be anchored also fail because of the tools required for this. With the A3 Report, for example, there are such tools. Just for clarity upfront, problem solutions, decision bases and strategies are presented on a sheet of paper in DIN A3 format. The A3 Report provides employees with a kind of template for which analysis and action steps must be taken when solving a problem. This process, in turn, is based on a systematic approach: the PDCA cycle.
The four phases of the PDCA cycle
Of all the quality improvement tools, the PDCA cycle is the most important. It describes the basics of an improvement process and divides it into four phases:
Phase 1: Plan
In this phase the problem and the actual state are described, the causes of the problem are analyzed and the target state is defined. In addition, measurements for reaching the target condition is defined.
Phase 2: Do (Implementation)
In the implementation phase, the predefined measures for achieving the target status are fixed.
Phase 3: Check
In the review phase, the experience gained and the results achieved in implementing the measures are reflected and the measures are readjusted if necessary.
Phase 4: Act
In this phase, the experience is gathered and the problem-solving process is evaluated and standards for future action are derived.

PDCA Cylce
Teams always go through this process when they have identified a problem or a relevant opportunity for an improvement. Then a new PDCA cycle is started with the aim of establishing a new standard in the company which serves as a basis for further improvements. The following case study shows how working with the PDCA cycle works.
The PDCA cycle explained using a case study
The management board of an electrical motor manufacturer has adopted a new strategy to further expand the company's quality leadership in electric motor production and increase customer satisfaction. To this end, the management team defined the following so-called breakthrough targets:
The production processes must be state of the art
The work must be based on the zero-defect principle
The striving for continuous improvement (CIP) should be anchored among the employees
These goals have been broken down to all levels. At a meeting, the head of department pointed out to the group leader that the five pressing lines he supervised produce less than the target of 35k motors per day. The consequences: Supply bottlenecks and customer dissatisfaction. The group leader should now solve this problem. In accordance with the PDCA cycle, the following procedure was followed.

This reading pick is from experienced manager and lecturer Ron Basu he lists tools and techniques you can implement to make the best use of Six Sigma and Lean Manufacturing, two major quality-control programs.
Read more here.
PDCA Phase: Plan
The group leader analyzed the production figures of the past weeks. He found that the joining line supervised by the team leader only delivers an average of 32k motors per day instead of 35k. The team leader suspected that this was due to high line rejects. They then took a look at the sorted motors in the quarantine stock. The result: the labelling on almost all rejected motors are displaced or not readable.
The group leader asks the team leader what could be the cause of the problem. His assumption: "The printer is not running perfectly and the application process is not stable. A check of the incoming labels has proven that all material is in specification, so the failure has to be within the printing and application process. The team leader then looked at the scrap figures in the shift reports. It turned out that over 80 percent of the rejected motors are produced during the night shift.
So the group leader and the team leader observed the labelling process in the following night shift. They noticed that the labeling belt occasionally jams in the conveyor belt, which is why the labels are applied offset to the desired location. The team leader suspected that this was due to the fact that the printer mounting and so the printer location was in the wrong position, a further analysis has shown that a new employee has been placed in the night shift and he didn’t understand the correct setting and placement of the printer after exchanging the labeling roll. In addition, it came out that the cartridge has to be replaced after 24 hrs which also was usually coming to the night shift. So the root cause was clear.
The group leader then asked the team leader to formulate a target state for possible countermeasures. He knows through trainings that targets should follow the SMART rule, but on this topic mainly measurable. He wanted to achieve the target by training the new operator. Done deal.
PDCA Phase 2: Do
But the group leader was not satisfied with that. He asked the team leader if he knew exactly how the operator were going to change roles and cartridges if there was a standard operation instruction (SOI) of this process and how to train new operators. The team leader denied this.
In the following night shift, they both watched the change of roles and cartridges by experienced and inexperienced operators. The experienced operators made sure that the labels did not touch the floor during the change and that the printer is in the correct position after replacing the role. The inexperienced, on the other hand, often rubbed the labels on the floor and just pushed the printer in the station without checking the first parts after replacement. Dirt gradually collected in the label dispenser, causing the tape to jam from time to time and the incorrect position of the printer led to misplaced and crushed up labels which in the end of line led to the rejects of the motors.
The group leader asked the team leader and his team to consider possible countermeasures, prioritize them and draw up an action plan. The countermeasures were among others:
5S sessions at the end of each shift to restore cleanliness and order in the line
Installation of training matrix in order to know how is able to follow the process and how is experienced enough to train new operators
Install a Poka Yoke fixture to ensure a process stable positioning of the printer
Install a counter with light indication when the cartridge of the printer needs to be replaced after an evaluated amount of labels printed
Based on the prioritization, the team members drew up an action plan. They also agreed:
The current status of the project is always documented on the cell board of the labelling line for the next three months
The progress figures are reported in the daily shop floor meeting – not the team meeting of the cell. It has mgt. focus.
PDCA Phase 3: Check
In the following weeks, the team leader of the cell reported daily the figures and the impact of the measures on the outcome. They also defined further measures on the basis of their experience to date. For example, the machine is always stopped when the label tape reaches into the light barrier, caused by an air blast. The measure was to install a duct for the carrier tape of the labels into a bin placed under the line, easily accessible for the line clean up at the end of the shift. As a result, the reject rate fell by almost 80 percent after three months. The initially formulated target of 40 percent fewer rejects was achieved.
PDCA Phase 4: Act
After this assessment, the group leader asked the team leader what he wanted to do with regard to standardization. He replied that he would prepare a written description of the optimal process "maintaining the label printer" as well as for training new operators. In addition, from now on he will carry out a daily process control in order to detect target/actual deviations earlier.
The group leader praised the team leader and asked him at the next team leader meeting to inform the team leaders of the four other production lines about the new standard and the findings in the PDCA problem-solving process so that they could learn from the experience. Him himself informed the head of the motor production department that the problem of insufficient motor production had been solved.

Doctor Nurse Principle
The operator creating the value (doctor) receives the materials and tools from the logistics provider (nurse), so that his/her primary activity is not interrupted by secondary activities.
In the Doctor Nurse principle, the operator creating value is considered as the doctor, he receives tools and goods he needs to do his job from the nurse in this case logistics. For this reason, the doctor can’t do his job without the support of the nurse.
What can we learn from hospitals and how can we adapt it to the lean world.
In hospitals it is crucial that the doctor can fully concentrate on a surgery, the doctor is the single point of contact towards the patient using his tools combined with his training. Everything distracting him from being focused has to be eliminated. In order to give him this capability he needs assistant right next to him. The nurse’s job is to support the doctor and provide him with all equipment, tools and material he needs just in time.
Applying this principle to production is not that hard. To use the doctor nurse principle on the shop floor some requirements have to be met. As mentioned think about the operators as the doctor, they have to concentrate on production. As they are the once generating value for the whole organization by assembling the components which customer are willing to pay for – they need to be placed in the center of all activities – the rest is supportive.
In lean manufacturing this is called the line-back approach. Primary processes are the once that add value so focus on the operation and prepare everything that supports it. The nurse takes care of all other activities, most of the time non-value adding activities but necessary.
Doctor Nurse Principle
Arrange the work station in a way that gives the nurse free accessibility to the work area without disturbing the doctor, i.e. filling up kanban shelfs with new material while simultaneously removing empty boxes.
With the approach of separation of primary and secondary processes in two physical areas none of the process will be interrupted by the other.
In addition, this principle is driving the mindset of the organization to focus on a lean production process and how best it can be supported. If you do so, you will also have the advantage by separating value-adding and non-value-adding activities to find you approaches to minimize the non-value adding activities.
Another way of calling the nurse a nurse is a water spider or in lean terms a Mizusumashi – the inbound material supplier.
Stay Connected

Ad
We want information fast and in a nutshell. We from OI recommend Blinkist* - because it’s simply the best.
* = Affiliate Link