LANGUAGE OF LEAN

Pareto Principle
The 80/20 rule demonstrates that things have an unequal distribution. Out of 5 one will fly and have the most impact. With 20 percent of action 80 percent of your target state is already reached.
The Pareto Principle describes that 80% of problems can be closed with 20% of the causes. This principle is named after Vilfredo Pareto who found out that 80% of Italy’s wealth belonged to 20% of the population.
With this in mind it is worth to have a look at it.
Let us start with an assumption, according to the Pareto Principle it allows us to assume that
20% of input creates 80% of the output
20% of customers create 80% of your revenue
20% of causes create 80% of failures
20% of your employees create 80% of sales
and so on…
But before you run away now and think you have the answer hold a second. With the 80/20 rule you might tend to say that it always have to be 100 - it’s not. Make a deep analysis before making such statements! 20% of your employees can also make only 20% of sales or 60%. So before you fire 80% of your employees keep in mind that the Pareto Principle only gives you an idea on the distribution.
The whole idea behind it is that most things in life are not distributed evenly!
When we talk about value adding activities and the final product is 100% What is with all the necessary tasks, that are not adding any value to the final product but have to be done to run the company.
Or think about failures and finding the root cause, where to start to take actions? This is great when you think about a Failure Pareto and you want to satisfy your customer as quick as possible. Of course you are focusing first on the most failures and most of the time - not always - the other failures will disappear as well.
But most important of all, your customer gains trust in you that you have the competencies to do the job.
The key point is that most things are not in a 1/1 actio = reactio relationship.
So what can we use it for this 80/20 rule?
The Pareto Principle in first place supports you on realizing that most of the outcome are based on a minority of inputs. This means:
20% of input creates 80% of the output > try to reduce those non value adding activities
20% of customers create 80% of your revenue > install a key account manager that the customers knows he/she is important to your company > your customers success is your companies success
20% of causes create 80% of failures > Focus on fixing those failures first
20% of your employees create 80% of sales > get those employees a reward
We could continue on and on. To bring it to the point > focus on the 20% and not on everything at the same time.
Some examples that might help you for a better understanding:
Instead of spending a whole night to prepare a presentation and thinking about where to start > focus on one topic and do it. You will get a feedback anyway during the pitch. This feedback gives you the chance to take it and improve it.
Instead of focusing on one solution that might be the best and go through all the details. Make a list of three and go through the pros and cons with your colleagues that probably know the topic better anyway and based on their opinion make a decision with what to go on.
Maybe this examples are nuts for you but we want to emphasize that you should focus only on the important 20% and forget - for the moment - the other 80.
Last but not least - the Pareto Principle is not a law of nature it is a guideline to steer your focus and to save time on problem solving or simply getting your job done faster.
Root Cause
The ultimate reason for an event or condition.
The Root Cause Analysis brings you to the ultimate reason for an event or condition
Methods used in the root cause analysis help you to identify the actual causes of defects or problems in your goods or processes. The whole idea behind a root cause analysis is to understand and get rid of the source of the problems and not to fight the symptoms. Thinking about quality management the Root Cause Analysis is a big part of it and has an impact on Six Sigma and 8D processes.
The root cause analysis is in demand when problems can no longer be solved with pure empirical knowledge (e.g. known products are used in new operating conditions and cause problems there).
The basic idea of all Root Cause Analysis methods is first of all to describe the problem (symptom) as precisely as possible, to limit the potential sources of the problem and then to systematically follow the error path. A distinction has to be made between purely theoretical analyses and experimental root cause analysis.
Known theoretical methods are the 5-Why question technique and the 6M method (Ishikawa). These methods, however, often suffer from the limitation to consider complex problems insufficiently. For example, it is impossible to identify combined root causes.
For complex problems, Vester's system analysis shows very good results in practice. Using the so-called intensity relationship matrix, expert knowledge is systematized and thus contributes to new approaches.
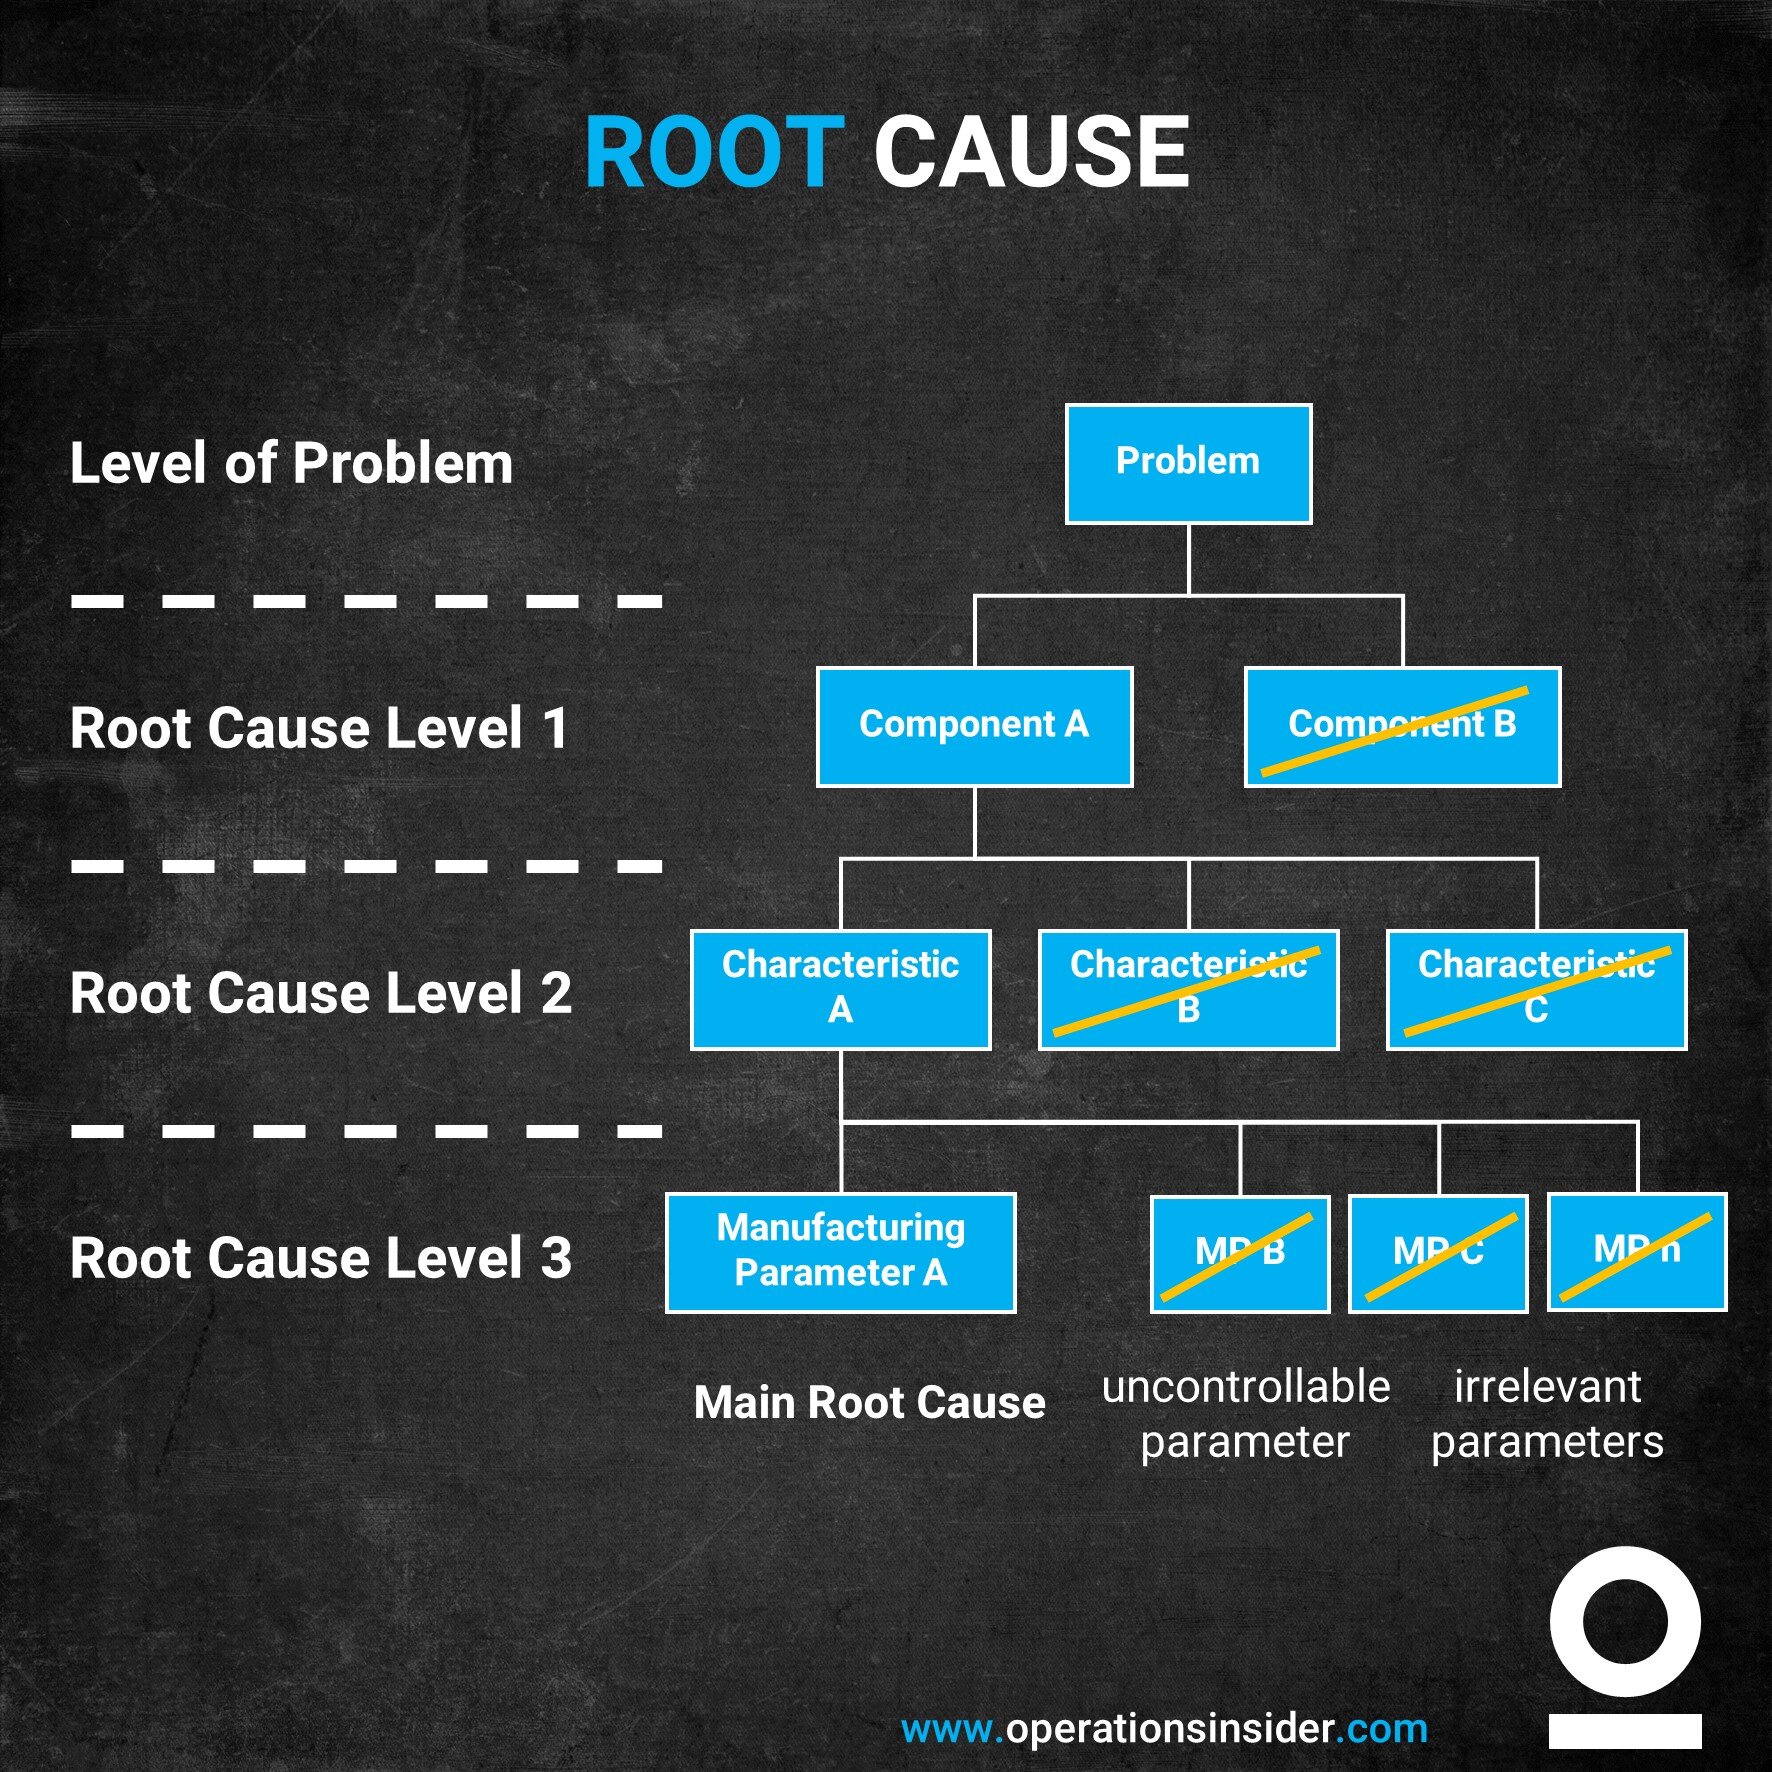
The area of root cause analysis also includes experimental designs that have the goal of eliminating a problem. A distinction must be made here between problems resulting from the production and assembly process and those resulting directly from the components or combinations of components. One of the well-known methods in this area is the component exchange methodology, which represents a methodically and statistically proven way of eliminating problems caused by components.
Apply Root Cause Analysis methods to your quality problem.
6M methodology (Ishikawa)
Vester` intensity relation matrix
Problem identification and identification through statistical product analysis in ongoing production through a practically established multi-stage problem-solving approach.
Root Cause Analysis

7 Steps - Problem Solving
The 7Steps problem solving is a standard analysis method.
The 7 Steps problem solving is an analysis method that is typically used in the 0miles major customer complaints and warranty complaints: when risk analysis is necessary. The single steps are as follows:
Problem description / risks on similar products and processes
Define containment actions
Data collection (grasping the facts / failure mode analysis)
Identify possible Root Causes
Implement corrective actions
Evaluate effectiveness (Tracking Chart)
Lessons Learned
Root Cause Analysis is one of the crucial and basic requirements in a quality system for continuous improvement. Its target is to recognize a deviation and its origins, resolve the issue so that it is not recurring and improve the quality of the product or processes. Root Cause Analysis always depends on time if you observe a deviation start asap your RCA-activities as no problem should be allowed to grow.
To gain a better understanding let us describe the 7 Steps in more details
1 Problem Description:
Capturing the deviation - Ask the following questions:
What is the problem? (symptom; use illustrations to describe as clear as possible)
Why is it a problem? (content of complaint / definition of problem statement)
Where was it detected? (location of occurrence/Area of the product or process)
When was it detected?
Who detected it?
How was it detected?
How many defective / suspect parts?
Can the problem appear on other products or processes?
Other parts
Generic parts
Opposite hand
2 Define containment actions:
Use a Tracking Chart to list your counter measures
Track how many defective parts have been detected
List in Pareto format what kind of failures have been detected
Put in containment actions and responsible person
Define when the actions have been planned and implemented
Data collection (grasping the facts / failure mode analysis) get and check the valid documentation:
1st part release
Maintenance records
Poka Yoke checks
Process parameters tracking charts
Work Instructions (SOI)
Control Plan
Drawings
Production information
Error collection sheet
First Time Through Report
Boundary sample
Ok part available
Ask the following questions:
Was it the correct process? - How should it be?
Was it the correct tool/fixture?
Was it the correct part?
Has something changed in the process?
Has something changed in the product design?
Is the process in control?
Do all product components meet quality requirements?
Collect pictures, evidences and records to support analysis.
3 Build the ISHIKAWA Diagram
List the problem to be studied in the "head of the fish".
Use an idea-generating technique (e.g., brainstorming) to identify the factors for non-conformance and non-detection within each category that may be affecting the problem and/or effect being studied.
Repeat this procedure with each factor under the category to produce sub-factors. Continue asking, "Why is this happening?" and put additional segments each factor and subsequently under each sub-factor.
Continue until you no longer get useful information
To learn more about the Ishikawa – read this article.
4 Identify the Root Cause
Analyze the results of the Ishikawa after team members agree that an adequate amount of information is provided for each major category. Do this by looking for those items that appear in more than one category. These become the “most likely causes".
For those items identified as the "most likely causes" the team should reach consensus on listing those items in priority order with the first item being the most “probable" cause. A useful method here is to allow each team member to allocate 3 points to their chosen root causes. The root cause with the most points can be taken for further analysis using 5 Why.
Once the most probable causes are drawn explain failure mechanism focusing on 2 aspects:
Cause of non-conformance
Cause of non-detection named
Use the 5 Why method for looking at the problem
5 Possible Actions
Create an action plan with countermeasures for non-conformance and non-detection to eliminate/minimize the effect
Do not forget about due dates and responsible persons (preferable only one person for one action)
6 Evaluate the effectiveness (Tracking Chart)
Put in permanent actions (+ responsibility) and make clear when the action has been planned, implemented and stopped. Track how many defect parts have been detected. After implementation of permanent actions remove containment measures only if there are no defects detected any more.
7 Lessons Learned
Visualize BEFORE and AFTER (KAIZEN REPORT)
Specify what needed to be documented (e.g. Standard Operating Instruction (SOI), etc.)
Grasp what you’ve learned (improvements in working and detection process)
Think about potential applicability in your organization (review similar design, equipment, components, processes, material or manufacturing processes).
Share what you have learned within your organization.
Some of the benefits of the Root Cause Analysis process are that you will identify which procedures will need to be changed, which documents describing those procedures will require modification and who will need to be trained or re-trained.
Finally, don’t forget that the root cause analysis process must lead to an effective corrective and preventive action plan. One without the other would mean that there is no certainty that the issue is solved and that the failure cannot reoccur.
If liked this article give it a thumbs up.

5 Why
The 5 Why methodology is a well known part of the root cause analysis. Key is to ask five times in the row – why?
The 5 Why methodology is a well known part of the root cause analysis. Key is to ask five times in the row – why? It is not the only way to determine the root cause(s) of problems. Just to mention that it usually comes together with an ISHIKAWA analysis. If you want to get deeper into problem solving including ISHIKAWA and 5Why we recommend you the article taking on the 7Steps approach.
The practice of asking why five times in a row whenever a problem occurs supports you on identifying root cause(s) and to determine effective counter measures that are developed through the process of 5Why. Then it is a simple part of PDCA to develop and implement effective measures.
To be able to steer a wide product portfolio, survive the competitive pressure and at the same time satisfying your customers with a high quality product at a reasonable price can be a tough game. Most of the time you don’t have enough time to run the complete product development cycle, do your validation and verification… The end of the story is that you start production because you need to deliver – which automatically leads to mistakes in running daily business. Therefore, the simple method of 5Why can be used to support, not only, your quality department to get faster to the bottom of problems.
The solution for a problem is not always easy, sometimes the root cause is hidden. Therefore the method is an important element of the root cause analysis. One tries to get to the root of the problem step by step with why questions, because one assumes that several causal connections interlock. The system is easy to explain, but there is a lot behind it. If you really take the time to ask the questions carefully and discuss them, the results are extremely profitable.
You should go through these steps of the 5-Why method. Describe your problem as detailed as possible. As more facts you have, you are faster on getting to the bottom of the problem.
What is the difficulty?
When did it first occur?
How often does it occur?
Is this failure randomly coming or reoccurring in a pattern?
Can you repeat the failure?
What is the effect of this failure?
and so on….
It is very important to get a fast idea of the situation on site. Take the Gemba Walk as great opportunity to talk to the people who are actually involved and to see it with your own eyes instead of guessing from your office.
Avoid making assumptions at this stage - you may draw the wrong conclusions.
Keep calm and try to understand the complete context first.
Understanding the context is where the 5-Why method comes in. Gradually ask why questions in order to get a feeling for the interrelationship of effects. This works for many areas of the company, in production, but also in your private life.
Example:
Problem: I miss all the fun part with my kids…
Why do I miss so much? - Because I’m not often at home.
Why am I not often at home? - Because of my position at work I have long working hours and business trips.
Why do I have long working hours and business trips? Because I can’t get my work done in 8 hours and bad in delegating work.
Why can I get my shit done in 8 hours and miss to delegate things? Because I’m sloppy in prioritizing and time management and don’t trust others.
Why can’t I prioritize my activities and don’t trust others? Because I don’t have the information needed to do so.
Reverse conclusion: If I’m not getting the necessary information in a certain amount of time in an acceptable quality I’m not able to steer my employees but also miss the time with my kids.
Sometimes 2 questions are necessary, sometimes 8 or even more to bring you to the “right” conclusion. But don’t give up half way.
Develop appropriate counter measures:
What contributes to solve the problem and who can implement which measures? How long will this take and what consequences will the implementation have?
First: I should try to have set timeframes with my kids which are holy and untouchable.
Second: I should define what information for me is necessary to run my company.
Third: According to the defined Information I train my employees what I need.
Fourth: I implement a clear systematic approach that I have all information latest at 11:00.
(DING DONG - Sounds familiar? BINGO — Shop Floor Management with a functioning meeting cascade.)
Keep the wheel spinning!
No matter what – before start implementing ad-hoc whatever you find best – take your time to identify what actions contribute to a real long term effect, what effects it will have on other areas, etc. Nothing worse than if you think you are doing something great but in reality you make it even worse.
The cycle of questions is often interrupted too early. The real cause is then not really eliminated and after some time there are repeated difficulties.
You can test it: If the reverse of your assumptions works, you are probably at the end of the causal chain.
As mentioned in the beginning another way is the ISHIKAWA diagram
Just keep in mind that not like with the ISHIKAWA the 5 Why only leads you to one cause for a problem. But as always in life there can be more than just one that leads to an effect. Therefore, the combination of 5Why and ISHIKAWA gives you the best approach to determine causes. It will allow you to represent several major and minor causes that can contribute to the solution.
Get the big picture with an ISHIKAWA drill it down with the 5Why.
Stay Connected

Ad
We want information fast and in a nutshell. We from OI recommend Blinkist* - because it’s simply the best.
* = Affiliate Link