
LANGUAGE OF LEAN

Push Principle
The Push Principle Concept/Term refers to a production system where material and products are manufactured and moved along the production line based on a predicted demand, rather than actual demand.
The Push Principle Concept/Term refers to a production system where material and products are manufactured and moved along the production line based on a predicted demand, rather than actual demand. This system operates under the assumption that the customer demand can be accurately forecasted and the production line can be appropriately scheduled to meet that demand.
However, the Push Principle often leads to negative impacts on operations. One of the main problems with this system is the assumption of accurate demand forecasting. In reality, customer demand is highly unpredictable and can fluctuate rapidly, leading to overproduction and inventory buildup. This excess inventory creates significant problems such as storage and handling costs, obsolescence, and potential quality issues.
Additionally, the Push Principle often results in an inefficient utilization of resources. The production line is designed to produce a set amount of product, regardless of actual demand. This can lead to idle time and equipment, increased energy costs, and reduced production capacity. The production process is also disrupted by production line breakdowns, worker absences, and equipment failures, resulting in increased downtime and decreased efficiency.
Another negative impact of the Push Principle is that it can lead to a lack of focus on customer needs. The emphasis is on meeting a predetermined production schedule, rather than meeting the actual needs of the customer. This can result in an overproduction of products that are not needed, as well as a lack of flexibility to adapt to changing customer demand.
To mitigate these negative impacts, Lean Management experts advocate for the implementation of the Pull Principle. The Pull Principle is a system where production is based on actual customer demand, rather than a predicted demand. This system allows for a more flexible and efficient utilization of resources, as well as a greater focus on meeting the actual needs of the customer.
In a nutshell, the Push Principle can lead to negative impacts on operations such as inventory buildup, resource inefficiency, and a lack of focus on customer needs. Lean Management experts recommend the implementation of the Pull Principle as a more efficient and effective alternative. By focusing on actual customer demand, organizations can achieve greater operational efficiency and meet the needs of their customers.

Bullwhip Effect
The bullwhip effect is a well-known phenomenon in lean management that can have a significant impact on the push and pull principles of supply chain management.
The bullwhip effect is a well-known phenomenon that can have a significant impact on the push and pull principles of supply chain management. The bullwhip effect refers to the amplification of demand fluctuations as they move up the supply chain, leading to increased inventory, increased costs, and decreased customer satisfaction.
The bullwhip effect is caused by a number of factors, including demand forecast errors, order batching, price fluctuations, and the use of incentives that encourage suppliers to order more than they need. These factors can cause suppliers to overreact to demand changes, leading to excessive inventory levels and higher costs.
The impact of the bullwhip effect on the push and pull principles of supply chain management can be significant. The push principle is based on the idea that suppliers produce goods based on demand forecasts, and then push the goods to the customer. The bullwhip effect can cause demand forecasts to become less accurate, leading to increased inventory levels, increased costs, and decreased customer satisfaction.
The pull principle, on the other hand, is based on the idea that suppliers produce goods based on actual customer demand. The bullwhip effect can cause suppliers to overreact to demand changes, leading to increased inventory levels and higher costs. This can result in a situation where suppliers are producing goods that are not actually needed, leading to a decrease in customer satisfaction and increased waste.
To address the bullwhip effect, organizations can implement a number of strategies, including improving demand forecasting accuracy, reducing order batching, reducing price fluctuations, and using incentives that encourage suppliers to order what they need, when they need it.
One approach to reducing the bullwhip effect is to implement a demand-driven supply chain management system. This involves using real-time data to better understand customer demand, and using this information to make informed decisions about inventory levels and production schedules. This can help to reduce the bullwhip effect, leading to more accurate demand forecasts, lower inventory levels, and increased customer satisfaction.
Another strategy to address the bullwhip effect is to implement a lean supply chain management system. This involves reducing waste, streamlining processes, and improving communication and collaboration between suppliers, manufacturers, and customers. This can help to reduce the bullwhip effect, leading to improved supply chain efficiency, lower costs, and increased customer satisfaction.
In a nutshell, the bullwhip effect is a well-known phenomenon in lean management that can have a significant impact on the push and pull principles of supply chain management. To address the bullwhip effect, organizations can implement a number of strategies, including improving demand forecasting accuracy, reducing order batching, reducing price fluctuations, and using incentives that encourage suppliers to order what they need, when they need it. By implementing these strategies, organizations can reduce the bullwhip effect, leading to more accurate demand forecasts, lower inventory levels, and increased customer satisfaction.

Kanban
The material in the Kanban System is exclusively oriented to the consumption of your production process.
In this article we want to talk about another classic from Lean Management Kanban or the so called Pull System.
The word Kanban itself has its roots in the Chinese Japanese language and means card, label or sticker. In industrial manufacturing planning systems or general in logistics control Kanban describes a replenishment system for consumed parts according to the amount used steered by cards that give the signal following the Pull Principle.
The material in the Kanban System is exclusively oriented to the consumption of your production process. The cards are a key element of this kind of control system and provide proper information transfer. Kanban control loops from the work station of flexible production control and serves to smooth material flow through your inbound or even outbound logistics. In addition Kanban serves you to implement a sustainable reduction of material stocks, increases the ability to deliver and saves you pure cash.
In an ideal world Kanban would control your entire value chain from the supplier to the end customer. In this way you would have installed an complete smooth supply chain with almost no chance of interruption and massive stocks. And now comes the but – to steer production with Kanban – a continuous monitoring is required for a smooth material supply. To make it short: it requires discipline from all involved parties along the supply chain.
Lets have a look to the development of Kanban.
The first Kanban System was developed by none other than Taiici Ohno (of course) at Toyota Motor in the 1940s. One of the main reasons for the implementation of Kanban was the low productivity and efficiency of Toyota compared to western competitors. With the Kanban System, Toyota achieved a significant change towards flexible and efficient production control that had a massive impact on productions output while at the same time reducing the costs for inventory in raw material, work in progress (WIP) and finished goods.
To give the complete picture it wasn’t implementing the Kanban system itself to drive the success of Toyota, there are other key factors that together where making the difference. Just to name Just in time as an example of key elements of the Toyota Production System. It is and always will be a combination of different methods and philosophy that brings you forward.
In the 1970s the Kanban Concept was adapted in the industry in the USA and Germany. As they haven’t known better, they pretty much copied the complete Toyota Production System (TPS) in order to get the principles running.
Pull or Kanban System
Either way you call it, the material flow is controlled by boxes or cards. Kanban Cards serving in a simple way all information needed to identify what parts are needed in what quantity at what place. The amount typically is defined by the replenishment time at the work station. With the so called two box principle you make sure that the operator never runs short on components. Nowadays there are also digital version of it called eKanban, but the principle behind is the same. The trigger of supply is the Kanban Card starting of the pull chain of material.
To use Kanban efficient, it is not suitable for all parts. Kanban is perfect for small parts with a small amount of variants and a consistent demand. For this reason, you’ll see Kanban Systems in the industry mostly used for C-Parts management. The rest of the components are steered with the support of MRP. Only in rare cases you find that even the supply of big components are controlled with the Kanban methodology.
One nice side effect with Kanban, you can set up the way you can steer your bottleneck. That means, when you have done a proper value stream analysis you know the capacity for your bottleneck and will only order what this process step can handle.

Poka Yoke
Poka Yoke are all mechanisms that prevent unplanned mistakes from happening.
Poka-Yoke is any mechanism that helps to avoid unplanned mistakes. Poka-Yoke is that the application of straightforward, error-proof mechanisms to systematically avoid incorrect assembly, mix-ups or the downstream movement of defective parts. As a result of stable and high-quality methods begin long before the assembly section, simple Poka-Yoke measures will be enforced preventively within the construction and coming up with phase to make sure quality. Poka-Yoke is implemented to avoid: going away out or forgetting process steps, process or operational-related mistakes, incorrect or missing parts, setup or installation errors.
POKA YOKE ポカヨケ ("stupid mistakes - avoidance") is associate ideology that takes a spread of approaches to optimize production processes, particularly assembly. The main target of Poka-Yoke is strive for zero-defect production and to attain it approximately. If defects are detected, the cause is determined. If the cause can be avoided, it's eliminated pretty much as good as doable within the sense of Poka-Yoke and at the best doesn't occur again at all. Poka-Yoke was originally an initiative of Dr. Shingo, Shigeo (新郷 重夫), who is additionally a co-founder of the Toyota production system, of that Poka-Yoke is a core component. Poka-Yoke is beneath the umbrella of Kaizen 改善 ("continuous improvement for the better").
Poka-Yoke may be about recognizing the root causes in time and so eliminating them. Mistakes shouldn't solely be corrected, however prevented the in the longterm by eliminating their root causes. Within the ideal case, in the sense of Poka-Yoke, there are measures that utterly rule out a discovered error by eliminating the cause in the future, e.g. as a result of incorrect mounting is not any longer doable because of fixed given mounting ways (e.g. fitting shapes). Poka-Yoke demands product style ability to make a product design that forestalls errors (avoid incorrect operation) and is powerful against errors (despite incorrect operation no faulty processes). Thus the philosophy of Poka-Yoke doesn't solely begin within the production, however already in the product design.
A widely known everyday example is that the plug of the electric devices and the power outlets, that can't be inserted into the socket the incorrect way round. Measuring instruments may also be designed or programmed in such a way that they will not be misused. Poka-Yoke principles can also be found in other cases, e.g. ATMs dispense your credit card before the payout takes place. Fuel dispenser faucets solely work into the right tank for diesel or petrol, creating it tougher to refuel incorrectly. And so on.
Looking at Poka-Yoke in production "Nobody makes any mistakes" is the target of the Poka-Yoke methodology. Here a list of some mistakes that can typically be found in production:
Incorrect positioning of assembly components
Incorrect change of a die
Incorrect mounting
Wrong interpretation of directions
Incorrect polarity in electrical connections
Incorrect reading of measured values
Incorrect connection of hoses
Incorrect entries in devices
Assembly of wrong components
Skipped operations
Operation/programming errors on machines
POKA YOKE follows three simple steps
Measurement:
If you can’t measure you can’t control. Simple fixtures or sensors up to high performance camera systems can support the right execution of processes and provides feedback about the correct or incorrect task completion. Measures can be taken by cameras, mechanical, sensor for light and colors, position, vibration, voltage or temperature.
Detection of deviation:
E.g. deviations are determined by checking the amount of tasks done during one operation - has had the operator enough movement to do the job? Are enough components used? (actual-target comparison). Or simple exploitation geometric mismatches when pins or special marking at the workstation are still visible or not used.
Regulation
When deviations occur make sure that measures are taken such as pulling the ANDON CORD by the so called stop the line authority. Only when error-causing steps are cancelled out a permanent production of OK parts can be achieved.
Only when living according to the Poka-Yoke philosophy on a daily basis and following the principles of Poka-Yoke you will be able to achieve with smart automation and trained operators long term success. Root Cause Analysis and sustainable counter measurements are key. In addition each operator should be trained to detect their own faults during operation.
It might seam to be waste to train operators to detect failures, but no matter how much you planing and effort you put in design, failures occur during assembly or manufacturing. Just think about wiring that is now crossing moving components, parts where the collision was not seen during design and so on, trust me the list can be endless. Some failures will be detected with smart automation checking devices. But these are typically very costly and need special trained people to maintain and most of the time these little pieces of technology can only do one job. Here joins Poka-Yoke the game. Cost efficient, failures or incorrect assemblies can’t be passed on and each operator develops an eye for deviation.
Just keep in mind that if you have mass production or small to middle series can determine if you should install a 100% check or if simple Poka-Yokes can get you where you want.
The most important part of Poka-Yoke at all is that failures are detected when they occur and the exponentially rising costs of defective parts passed on are prevented.


Value Creation
What the customer is willing to pay for.
The exact opposite of waste is value creation. That is what you aim for with all lean activities. Value creation are all activities that create or add value to your service or product and the customers are willing to pay for. When a service or product has been perceived or appraised to fulfill a customer need or desire as defined, the product or service may be said to have value or worth. Components of value may include quality, utility, functionality, capacity, aesthetics, timeliness or availability, price, etc.

8D
8D Reports are used to communicate results of taken problem solving steps to the customer in a standard format.
The so called “8D”-Report is a document resulting from an 8D process which is part of a structured problem solving process in quality management if there are quality issues between customer and supplier.
8D represents the eight mandatory process steps that are performed when processing a claim to get to the root of the cause. The report details the nature of the claim, responsibilities, and actions taken to prevent the problem from reoccurring:

The 8D methodology is intended to ensure that complaints are dealt with systematically. Consistent documentation of the associated troubleshooting steps and a high level of fact orientation ensure that errors in the product or system are thoroughly investigated and thus permanently corrected instead of just solving the problem.
Application
These eight steps are performed for the 8D report:
1 Define a team to solve the problem
A team familiar with the process and/or the product is formed. They analyze the problem, take corrective actions, and monitor the effectiveness.
2 Describe the problem
In this step, the problem is defined as precisely as possible and the root cause of the problem is identified.
3 Containment action
These measures are intended to resolve the problem quickly and limit the damage until a permanent solution is found.
4 Root cause analysis
You probably haven’t found the real root cause during step 2 therefor various tests and experiments are used during step 4 to search for the real root cause of the error and the most likely causes are identified. This is intended to ensure that similar errors do not occur again.
5 Planning of counter measures
It then determines the means by which the causes of the problem can be eliminated. It is tested whether these measures solve the problem efficiently and no undesired side effects occur.
6 Check effectiveness of counter measures
Once the corrective actions have been carried out successfully, the immediate actions must be stopped. In the automotive industry, only process-improving measures are regarded as permissible shutdown measures.
7 Prevent recurrence of error
To ensure that such an error does not happen again, the team must initiate and monitor preventive measures. In the automotive and aerospace industries, manufacturers must use the FMEA method to assess the risks identified during root cause analysis. .Also, quality management system rules and procedures may need to be adjusted.
8 Appreciation of team performance and Lessons Learned
In a last step, the achievements of the team are recognized and experiences are exchanged.

Sensei
In the lean world a sensei is a lean production expert that transfers his knowledge as mentor on to his mentees.
In the lean world a sensei is a lean production expert that transfers his knowledge as mentor on to his mentees.
To be successful with a Sensei it's been revealed that you need to start at the top and find a sensei to work with in order to engage all employees on the shop floor. As Lean activities reach industrial maturity, the role of the Sensei remains a gray area.
It is obvious that your organization needs a Sensei to adapt and successfully implement Lean principles. Therefore, the Sensei position will be your bottleneck in Lean implementation. In every Lean transformation process, one learns at some point that the success of a company consists in learning to learn.
As a little guide, consider the following three effects:
Learning curve: The learning curve of each department and initiative is tracked by their manager in the organization rather than having to compare it to established best practices across your organization.
Spillover: Effective learning practices are passed through hands-on, experiential learning from person to person within your organization rather than through predetermined processes.
Value-Based: Lean as a whole provides a learning framework that aims to balance customer satisfaction (which leads to organizational success) with employee satisfaction (and personal fulfillment) through a set of principles and tools aimed at discovering how MUDA can be reduced and value can be increased . Adding activities in all areas of the organization.
This approach has both sides of the medal, but the weak and the strength are lying in the learning path of each employee. Following the lean principles, every employee is expected to discover:
What do I need to learn: What is my personal challenge in order to better align my work with customer value and thus sustainable and profitable growth with the satisfaction of all my colleagues to reconcile.
Learning from the shop floor: The learning style is deeply embedded in daily operations. Employees are learning results from their support of learning activities at all levels. Because all employees solve their problems or show initiative, everyone is expected to interpret the conclusions of others and find a way to adopt the solutions to their own work. It is the responsibility of the Sensei to support its learners in this learning phase. Learning by doing is the correct way to describe it.
Create a learning environment for your employees: Learning on the job is never easy, especially in today's business climate. Consequently, one of the key functions of a Sensei in the Lean perspective is to create a visual environment for employees where it is easier to recognize than normal and where opportunities for continuous improvement in small steps (Kaizen in Lean jargon) are clearly visible Everyone. A learning environment also means a stable affective environment where mistakes are not punished but seen as a source of learning.
The Sensei is not a boss at all. He or She has no power and can only suggest. The Sensei's task is to help all employees in your organization to develop their own lean thinking through practical exercises in workshops. The Sensei's job is to convince middle managers that solving today's problems will, in the long run, prevent tomorrow's fires.
The essence of Lean is learning while solving problems. This is a difficult task at the best of times, and indeed every person in your organization must be taught to learn how to learn. In relation to managers, the Sensei has five main roles of support:
Finding problems
Tackling problems
Creating problems
Solving problems
And finally learnings from problems
"If you have no problems, you are dead". is a classic lean principle. Perhaps the most important part of Lean's problem-solving learning approach is the initial problem-finding phase. Lean's approach to business is to capitalize on every problem.
“Sometimes you WIN sometimes you LEARN!”

5M Method
5M Method is an other way of describing an ISHIKAWA Diagram.
5M Method is just an other way of describing an ISHIKAWA Diagram. This diagram is pre-structured with five given categories of potential causes: “Man”, “Machine”, “Material”, “Mileu = Environment” and “Methodology”. In a more detailed form of the environment you can further divide it in “management” and “measurement” which then is considered as 7M methodology.

YOKOTEN
Japanese for “across everywhere”.
Japanese term meaning “across everywhere”. With Yokoten the knowledgetransfer is carried out and all activities and countermeasures along the continuous improvement process are communicated organization wide and with other branches of the organization and its affiliates.
Yokoten is not just another Japanese word of the lean world. It might seem fancy to have only Japanese terms on the lean journey but one word isn’t that mainstream and well known but crucial when it comes to lean transformation in your organization. Yokoten describes the process of sharing knowledge across your organization. It includes systematics such as lead plans for copying and improving kaizen activities that work in your complete organization.
Think of Yokoten as horizontal deployment of improvement actions. The Yokoten approach is horizontal and peer-to-peer, with the expectation of Gemba Culture that your people go and see for themselves and learn how other departments or plants in your organization improved their processes. The idea behind is global knowledge transfer of improvement actions as basis for individual local solutions.
It is crucial that it is not a top-down thing where in all plants of your organization everything has to be the exact same. That simply will not work. It is more a benchmark where e.g. one plant in your organization is the champion of one manufacturing process (e.g. injection moulding). Therefore this plant is the “Lead Plant” and by this the benchmark for injection moulding organization wide. All other plants with injection moulding are welcome to the “Lead Plant” to learn from their experience and adopt the Kaizen activities to their own individual needs. With this kind of knowledge transfer a sustainable improvement and collaboration in your organization will be established.
In a nutshell, Yokoten can be understood as internal copy and improve. The role as senior manager is to spread the information and build bridges between the different locations/plants and give the transfer of knowledge a little jump start. Make your organization learn and improve from each other, most of the time there are already good examples out there and just want to be explored and further improved.
The long term success will prove that it is not the processes but the people that are continuously developed, that make the difference between a growing and successful organization or a simple copy cat of Kaizen activities.
The effective Yokoten process is a crucial brick for the foundation of a true learning organization. And no matter where you look at, truly successful organizations have a functioning organization wide knowledge transfer installed.

Hansei
Japanese term meaning to accept your personal responsibility for your own mistakes and the will for improvement. The Hansei Assessment can be seen as deep personal reflection.
The Japanese term of Hansei has the meaning to acknowledge your own mistake(s) and to strive for improvement. The term describes your personal ability of reflection and will to do better.
Hansei plays a big role when thinking about the continuous improvement process and specially the part of looking back and reflect of what could have gone better or where you as person did come short and have a potential lesson.
At Toyota, Hansei is a fixed part of their production system. The Hansei Assessment is held to have a deep review or personal reflection. Typically these assessments are conducted during milestones or at the end of a project during the lessons learned part. The results are communicated to the whole organization so that all can profit from the knowledge gained from this process. By this you will support your complete organization from repeating mistakes or even improve existing standards in order to prevent this from happening again.
You see Hansei can be seen as a crucial part of the organizational development and as heavy weight components for the continuous improvement process, KAIZEN activities and standardized work, as in the end it is up to humans to run your organization and we all make mistakes we can learn from.
In a Hansei assessment you have 4 Elements to analyze and the questions to find an answer.
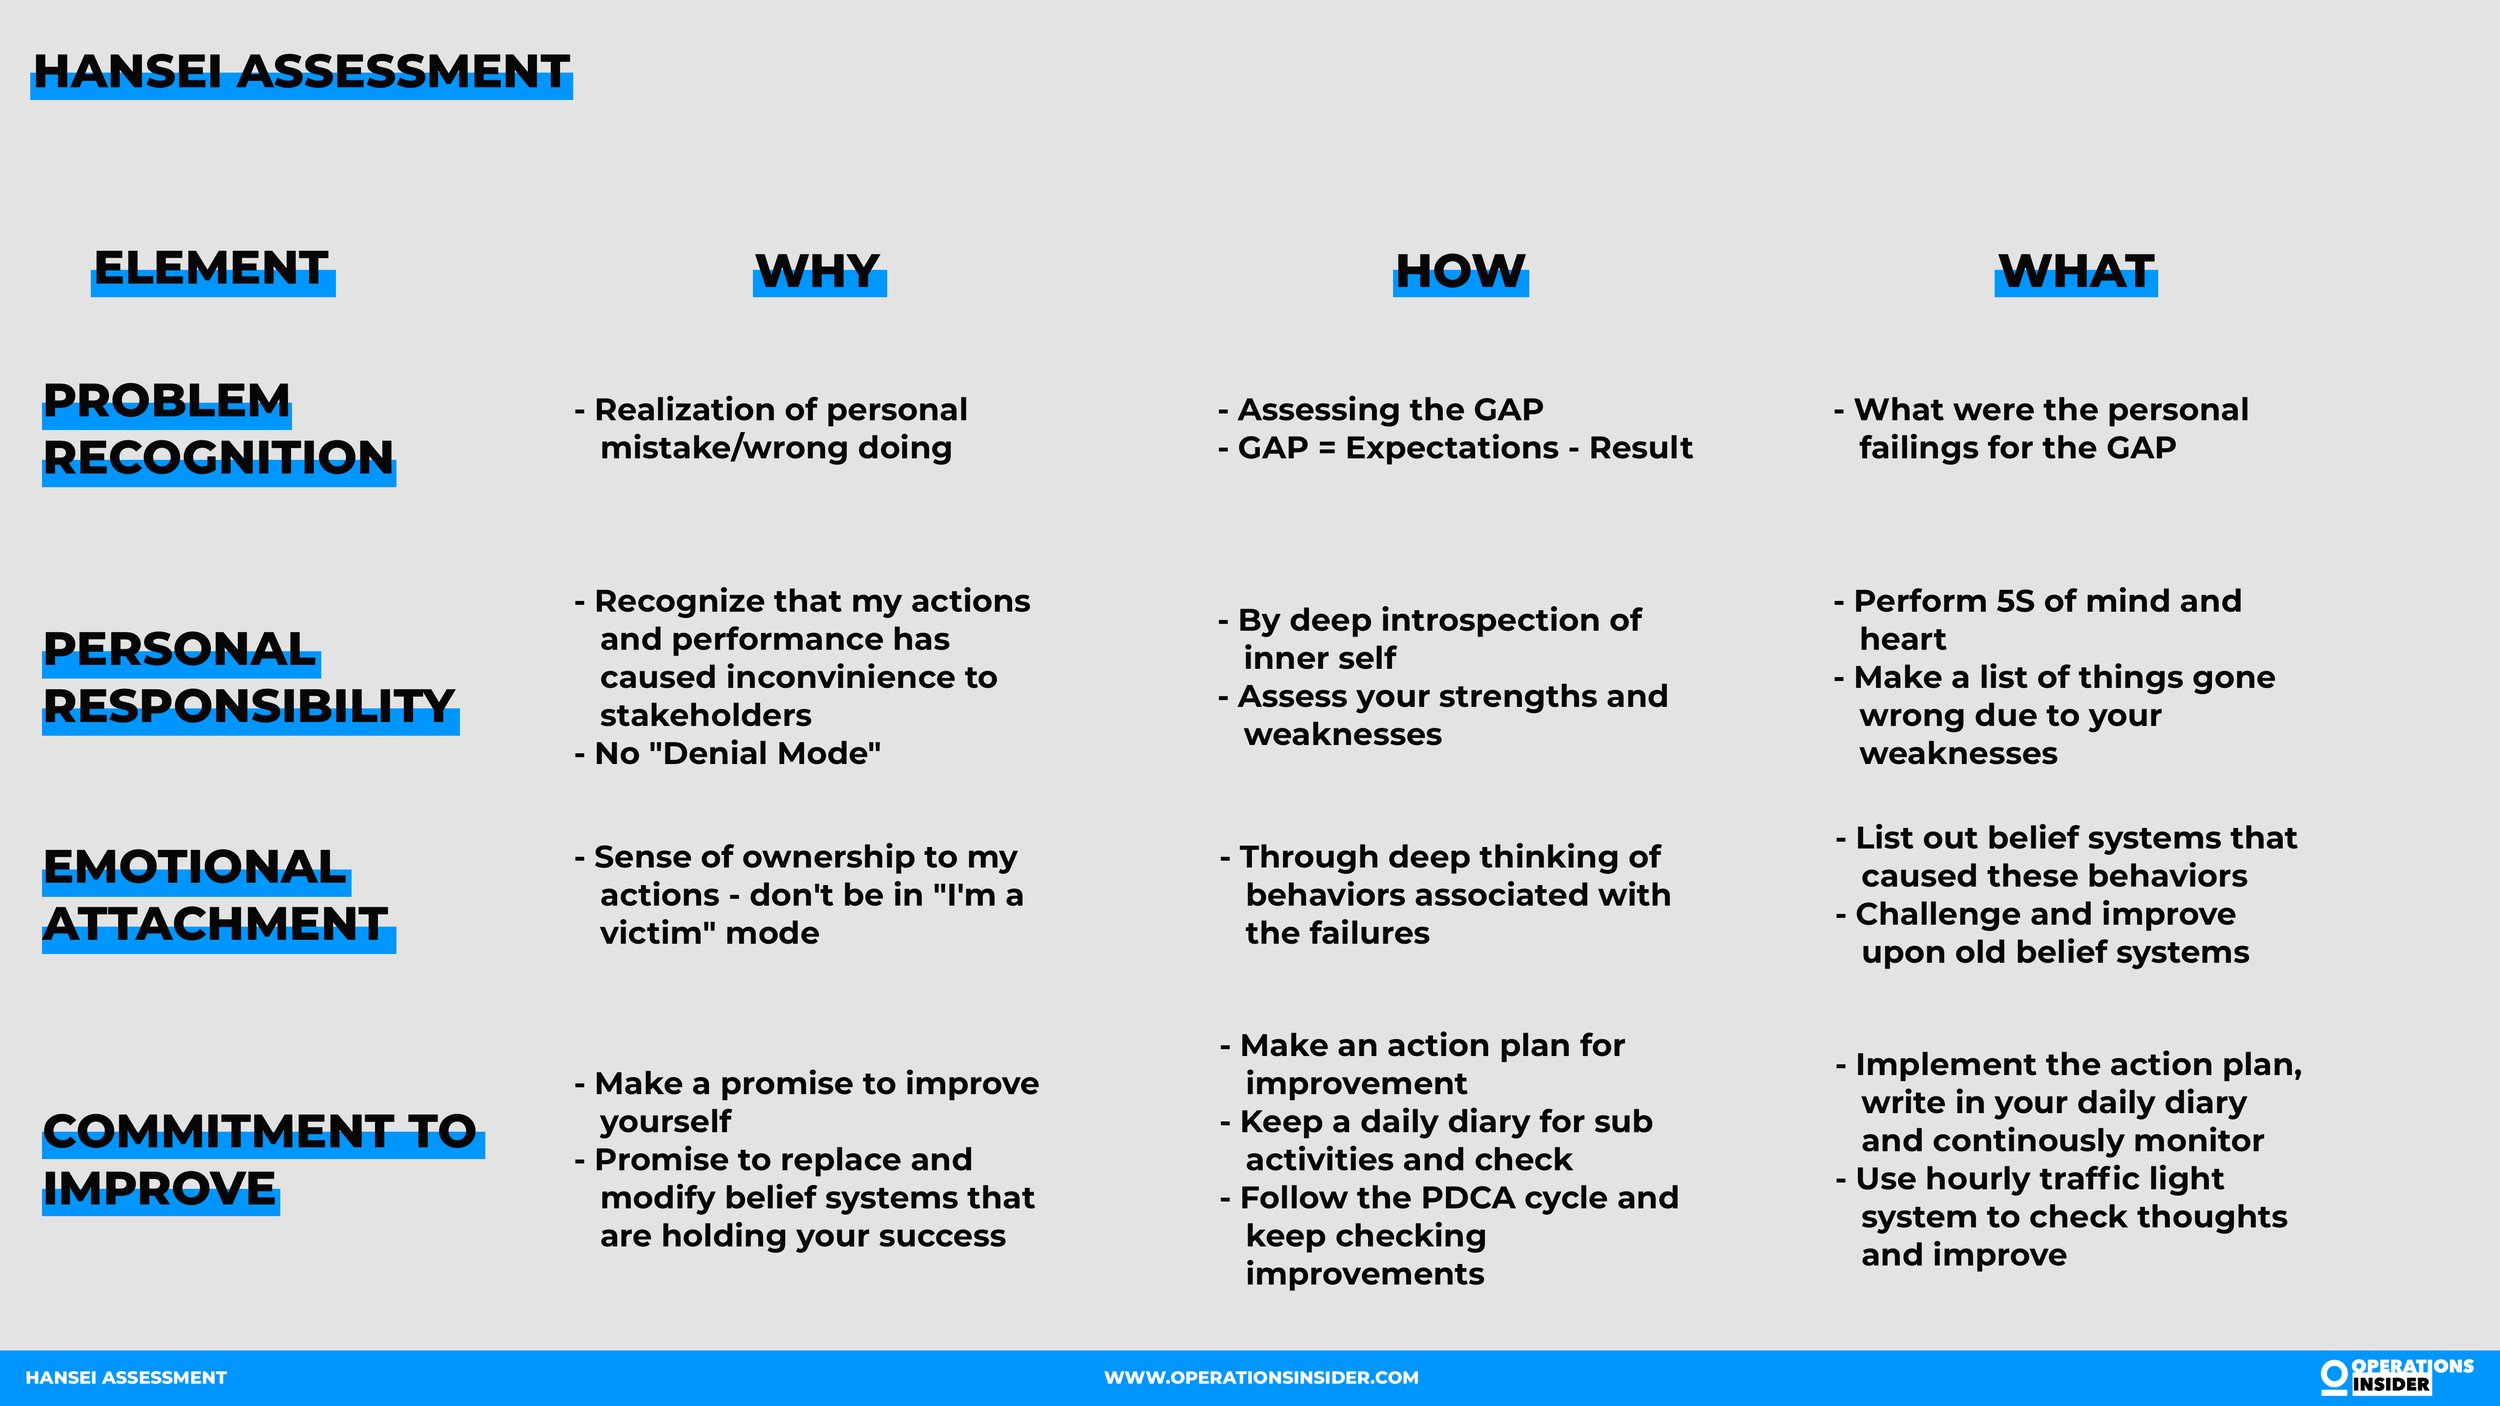
Hansei Assessment

Implementation of 5S
The 5S Method is a five-level system for the provision of safety, cleanliness and orderliness on the workplace.
If you want the short version just go here. Otherwise we will deep dive in this article on how to implement the 5S methodology in your organization. We will simply follow the 5 Steps and explain the topics.
1st S SEIRI = Sort out all unnecessary objects
Unnecessary objects are all objects that are not needed for the current manufacturing processes (production, logistics, quality, and administration, etc.), that means, defective parts, unused material, material that has been written-off, all spare parts, non-utilized tables and so on
Determine in advance, what is truly needed. This is helpful when dealing with statements such as: “That still can be used“, “That should be useful for something,“ etc.
Remove all redundant objects or at least visually mark them so that everybody is aware that they are to be disposed of
Unused objects should be concentrated in one marked closed area. The decision about those that can not be immediately liquidated, as whether to dispose of them, should be made by the person responsible within 2 weeks
Target: At the workplace are only objects essential for the current work in progress.
Red Tag Campaign
Ask three questions for each separate object:
Is this object useful?
How many of these objects do we need?
Where should this object be stored?
Don‘t support others in searching for excuses. Be fair – mark objects that should be removed in all divisions of the company
Don‘t compromise! When in doubt - the rule applies: Get rid of it!
If there are suggestions for improvement of the current manufacturing process, it is possible to “red tag“ even objects still in use
Make sure that everybody understands what should be marked and why
Course of action and rules for the “Red Tag Campaign”
Write on the tag why the marked object is not needed (Example: Surplus packing boxes; parts stored in boxes are not used any more)
Contact Information about the person who made the decision that the object is superfluous (name and department)
The person responsible for the object will be informed and their name will be entered on the “Red Tag”, and along with the agreed-upon date of removal (maximum 3 days), the action should be recorded (Example: The employee who recognized that the boxes are not used anymore, will inform the warehouse attendant and will appeal to him to verify if they are really not of use anymore. If it will be discovered that the object is still in use, the “Red Tag” will be removed. (For instance: The warehouse manager finds out that the boxes will be used to store other parts very soon)
If the object will be classified among the superfluous, it must be removed within three days by the person who has the responsibility for this area. (For instance: Redundant storage boxes - person responsible for the warehouse). Afterwards the “Red Tag” can be liquidated
Objects can be “Red Tagged” only in working areas of ones responsibility. The Shift Leader can issue “Red Tags” in the entire area they are responsible for
The “Red Tag” will be filled out by hand and attached to the unwanted object.
Examples of unwanted objects:
1 Defective products
Faulty parts
Rejects
2 Unnecessary objects
Unused empty packaging
Personal objects (on undefined places)
Unneeded assembly sets
Unused material (remaining bundles)
Unused tools, auxiliary and production material
Inventory no longer being used
Surplus of manufactured components
2nd S SEITON = Clean-up and correct arrangement of needed objects
After the removal of all unnecessary objects, remove all uncleanness, as new organization of areas for laying down objects or their storage can start only after everything is clean
Each machine and each tool must have its designated place.
Thoroughly deliberate about where you will store material, tools, and equipment
Use colored markings (for instance stickers) to designate areas, cabinets, shelves, cupboards with shelves, important places, direction of work procedures, etc.
With each object ask three key questions: Where? What? How many?
Permanent storage of objects in
Targets:
A place for each object and each object in its place
Visual control and expedient detection of deviations
Proper storage of all needed objects in the right place. These objects can then be found and used whenever needed
Every thing has its own place and after its use is always returned to its place!
Think about color markings on the floor e.g.:
Yellow = transportation zone
White = raw material
Green = finished goods
Red = closed area/NOK parts
3rd S SEISO = Keeping the workplace tidy so as to achieve the already established standards through 5S
The purpose of the cleaning action is to remove all contamination from the workplace and to maintain it in order.
For this purpose a cleaning schedule will be formulated that will determine what is to be cleaned, with what, and by whom
If you discover any shortcomings or abnormalities during the cleaning process – mark them down
All employees of the workplace / work area will participate in the cleaning process
Keep records of the cleaning process, display visually “Red Tags,” as well as the clean-up time schedule of your workplace. Display results
Define responsibilities with consideration even to the smallest work sections
Be effective. Even a five-minute cleansing action can achieve a lot
Targets:
Cleaner and safer workplace
Achieving the already established standards
Cleanliness
Cleanliness at the workplace must be observed, because a clean workplace is essential towards quality and safety at work
If the workplace is not dirty it is not necessary to clean it
Any kind of uncleanness and any kind of untidiness will be visible thanks to the initiation of a regular cleaning process – for instance, dusting, sweeping, and waste disposal
Continuous usage of equipment
Removal of all uncleanness and untidiness
Prevention of working accidents
Cleanliness means controlling, which implies that when cleaning a certain workplace, also check the state of the machinery, equipment, and working conditions
4th S SEIKETSU – Establishing regulations for work standards
SEIKETSU has the greatest importance of all 5S Steps.
With this 5S Step the main focus is on three aspects:
No unnecessary objects
No messiness and
No uncleanliness
Visual control is the first step towards discipline. The ideal workplace is that with which any eventual problems can be detected at first glance – any corrective measures can be immediately implemented
Use control lists to control the 5S standard and to identify deviations from the defined 5S standards
Conduct 5S audits with consideration to the situation on the individual work place. Attempt to identify deviations from the 5S standards
Ask yourself “follow-up questions”, as for instance: Has the mess been cleaned up immediately? Is it clear who is supposed to do the job? Can the clean-up be done quickly? - and others
Targets:
Securing the adherence to the 5S Standards
Increasing the team responsibility on the work place
Schedule of everyday clean-up
5th S SHITSUKE – Adherence to the Work standards and continuous improvement
Discipline, namely, adherence to work standards is basically a question of personal attitude. For it to be easier, various teaching aids are used, e.g. Courses of the 5S Basics
Use photographs, single-topic lectures, video-programs and presentations
Constructive criticism is the foundation for proper 5S training
Take pictures to document the status quo before and after
The Team Leader functions as an example to the team. During his work he should focus on the goals of 5S, he should strive for a continuous improvement of quality and in this direction aim his training activity also
Define together the measures for improvement and how to realize them.
Regulations are better than criticism and a system is better than regulations
Targets:
Promotion of this know-how in the entire company from top-to-bottom
Well-organized work places that require only the minimum attention

Andon
Andon is a crucial part of visual management on the shop floor that gives a signal that indicates if and where there is a problem.
Andon is a crucial part for the visual management on the shop floor that gives a signal that indicates if and where there is a problem. Typically indicated with a traffic light signal red = failure mode, yellow = non-conforming performance and green = normal operation mode.
The methodology of Andon as part of the shop floor management, is to show the current operating status of a machine or a production line in a way that everyone can see and understand it immediately. As typically in Lean Terms Andon comes from the Japanese language and means paper lamp or just lamp.
Going along the Andon-Systematic there is to mention the Andon-Cords. The cords are used by operators to activate the lamps by either tear the cord or more likely nowadays pressing the corresponding buttons, which are attached above the production line and are easily accessible for the operators hanging downwards or as button attached at the work station.
If a non-conforming condition occurs, the yellow Andon signal initiates the support so that the problem that has occurred can be remedied immediately with additional supportive functions, such as maintenance. In worst case it is also possible to stop the complete production (red signal) until the problem has been solved or at least suitable countermeasures are in place.
An Andon has three main functions:
Visualization of the operating status of a machine/assembly line
Possibility for the operator to report an non-conforming condition and escalate it using a defined escalation process
Production or belt stop, so that no non-conforming products or components are passed on to the next process step

Old fashion Andon Board
The clear display of the operating states of several workstations was used quite early in the development of the Andon systems. The godfather of the TPS, Taiichi Ohno once described it as followed: "When one looks up, the andon (the line stop indication board) comes into view, showing the location and nature of trouble situations at a glance."
In the course of time, the Andon board has increasingly developed into an information board for all employees involved in the process. They display status information regarding the current situation in production, such as the number of units produced per day or per hour, the degree of delivery reliability to the customer or the cumulated amount of backlog. In this way, all process participants are aware of the current situation and can act accordingly.

Andon Boards nowadays

Hanedashi
Is a device or means for automatized unload of a work item from one process or operation, providing the correct state for the next item to be loaded.
Hanedashi is called a device or means for automatized unload of a work item from one process or operation, providing the correct state for the next item to be loaded. The Hanedashi principle of automatized unloading and orientation for the next process is often used in automated production systems that operate according to the Chaku-Chaku principle.
When designing a machine according to the Hanedashi Principle, the only manual operation is to insert the workpiece. The processing and afterwards the ejection is fully automated, the workpiece than can be transported to the next machine or handed over to the next operator. Meanwhile, the machine automatically returns to the initial position where it can be reloaded.
The conclusion of the Hanedashi Principle: Humans are better for loading and machines are better for unloading. It is that simple to knock it down.

7 Steps - Problem Solving
The 7Steps problem solving is a standard analysis method.
The 7 Steps problem solving is an analysis method that is typically used in the 0miles major customer complaints and warranty complaints: when risk analysis is necessary. The single steps are as follows:
Problem description / risks on similar products and processes
Define containment actions
Data collection (grasping the facts / failure mode analysis)
Identify possible Root Causes
Implement corrective actions
Evaluate effectiveness (Tracking Chart)
Lessons Learned
Root Cause Analysis is one of the crucial and basic requirements in a quality system for continuous improvement. Its target is to recognize a deviation and its origins, resolve the issue so that it is not recurring and improve the quality of the product or processes. Root Cause Analysis always depends on time if you observe a deviation start asap your RCA-activities as no problem should be allowed to grow.
To gain a better understanding let us describe the 7 Steps in more details
1 Problem Description:
Capturing the deviation - Ask the following questions:
What is the problem? (symptom; use illustrations to describe as clear as possible)
Why is it a problem? (content of complaint / definition of problem statement)
Where was it detected? (location of occurrence/Area of the product or process)
When was it detected?
Who detected it?
How was it detected?
How many defective / suspect parts?
Can the problem appear on other products or processes?
Other parts
Generic parts
Opposite hand
2 Define containment actions:
Use a Tracking Chart to list your counter measures
Track how many defective parts have been detected
List in Pareto format what kind of failures have been detected
Put in containment actions and responsible person
Define when the actions have been planned and implemented
Data collection (grasping the facts / failure mode analysis) get and check the valid documentation:
1st part release
Maintenance records
Poka Yoke checks
Process parameters tracking charts
Work Instructions (SOI)
Control Plan
Drawings
Production information
Error collection sheet
First Time Through Report
Boundary sample
Ok part available
Ask the following questions:
Was it the correct process? - How should it be?
Was it the correct tool/fixture?
Was it the correct part?
Has something changed in the process?
Has something changed in the product design?
Is the process in control?
Do all product components meet quality requirements?
Collect pictures, evidences and records to support analysis.
3 Build the ISHIKAWA Diagram
List the problem to be studied in the "head of the fish".
Use an idea-generating technique (e.g., brainstorming) to identify the factors for non-conformance and non-detection within each category that may be affecting the problem and/or effect being studied.
Repeat this procedure with each factor under the category to produce sub-factors. Continue asking, "Why is this happening?" and put additional segments each factor and subsequently under each sub-factor.
Continue until you no longer get useful information
To learn more about the Ishikawa – read this article.
4 Identify the Root Cause
Analyze the results of the Ishikawa after team members agree that an adequate amount of information is provided for each major category. Do this by looking for those items that appear in more than one category. These become the “most likely causes".
For those items identified as the "most likely causes" the team should reach consensus on listing those items in priority order with the first item being the most “probable" cause. A useful method here is to allow each team member to allocate 3 points to their chosen root causes. The root cause with the most points can be taken for further analysis using 5 Why.
Once the most probable causes are drawn explain failure mechanism focusing on 2 aspects:
Cause of non-conformance
Cause of non-detection named
Use the 5 Why method for looking at the problem
5 Possible Actions
Create an action plan with countermeasures for non-conformance and non-detection to eliminate/minimize the effect
Do not forget about due dates and responsible persons (preferable only one person for one action)
6 Evaluate the effectiveness (Tracking Chart)
Put in permanent actions (+ responsibility) and make clear when the action has been planned, implemented and stopped. Track how many defect parts have been detected. After implementation of permanent actions remove containment measures only if there are no defects detected any more.
7 Lessons Learned
Visualize BEFORE and AFTER (KAIZEN REPORT)
Specify what needed to be documented (e.g. Standard Operating Instruction (SOI), etc.)
Grasp what you’ve learned (improvements in working and detection process)
Think about potential applicability in your organization (review similar design, equipment, components, processes, material or manufacturing processes).
Share what you have learned within your organization.
Some of the benefits of the Root Cause Analysis process are that you will identify which procedures will need to be changed, which documents describing those procedures will require modification and who will need to be trained or re-trained.
Finally, don’t forget that the root cause analysis process must lead to an effective corrective and preventive action plan. One without the other would mean that there is no certainty that the issue is solved and that the failure cannot reoccur.
If liked this article give it a thumbs up.

5 Why
The 5 Why methodology is a well known part of the root cause analysis. Key is to ask five times in the row – why?
The 5 Why methodology is a well known part of the root cause analysis. Key is to ask five times in the row – why? It is not the only way to determine the root cause(s) of problems. Just to mention that it usually comes together with an ISHIKAWA analysis. If you want to get deeper into problem solving including ISHIKAWA and 5Why we recommend you the article taking on the 7Steps approach.
The practice of asking why five times in a row whenever a problem occurs supports you on identifying root cause(s) and to determine effective counter measures that are developed through the process of 5Why. Then it is a simple part of PDCA to develop and implement effective measures.
To be able to steer a wide product portfolio, survive the competitive pressure and at the same time satisfying your customers with a high quality product at a reasonable price can be a tough game. Most of the time you don’t have enough time to run the complete product development cycle, do your validation and verification… The end of the story is that you start production because you need to deliver – which automatically leads to mistakes in running daily business. Therefore, the simple method of 5Why can be used to support, not only, your quality department to get faster to the bottom of problems.
The solution for a problem is not always easy, sometimes the root cause is hidden. Therefore the method is an important element of the root cause analysis. One tries to get to the root of the problem step by step with why questions, because one assumes that several causal connections interlock. The system is easy to explain, but there is a lot behind it. If you really take the time to ask the questions carefully and discuss them, the results are extremely profitable.
You should go through these steps of the 5-Why method. Describe your problem as detailed as possible. As more facts you have, you are faster on getting to the bottom of the problem.
What is the difficulty?
When did it first occur?
How often does it occur?
Is this failure randomly coming or reoccurring in a pattern?
Can you repeat the failure?
What is the effect of this failure?
and so on….
It is very important to get a fast idea of the situation on site. Take the Gemba Walk as great opportunity to talk to the people who are actually involved and to see it with your own eyes instead of guessing from your office.
Avoid making assumptions at this stage - you may draw the wrong conclusions.
Keep calm and try to understand the complete context first.
Understanding the context is where the 5-Why method comes in. Gradually ask why questions in order to get a feeling for the interrelationship of effects. This works for many areas of the company, in production, but also in your private life.
Example:
Problem: I miss all the fun part with my kids…
Why do I miss so much? - Because I’m not often at home.
Why am I not often at home? - Because of my position at work I have long working hours and business trips.
Why do I have long working hours and business trips? Because I can’t get my work done in 8 hours and bad in delegating work.
Why can I get my shit done in 8 hours and miss to delegate things? Because I’m sloppy in prioritizing and time management and don’t trust others.
Why can’t I prioritize my activities and don’t trust others? Because I don’t have the information needed to do so.
Reverse conclusion: If I’m not getting the necessary information in a certain amount of time in an acceptable quality I’m not able to steer my employees but also miss the time with my kids.
Sometimes 2 questions are necessary, sometimes 8 or even more to bring you to the “right” conclusion. But don’t give up half way.
Develop appropriate counter measures:
What contributes to solve the problem and who can implement which measures? How long will this take and what consequences will the implementation have?
First: I should try to have set timeframes with my kids which are holy and untouchable.
Second: I should define what information for me is necessary to run my company.
Third: According to the defined Information I train my employees what I need.
Fourth: I implement a clear systematic approach that I have all information latest at 11:00.
(DING DONG - Sounds familiar? BINGO — Shop Floor Management with a functioning meeting cascade.)
Keep the wheel spinning!
No matter what – before start implementing ad-hoc whatever you find best – take your time to identify what actions contribute to a real long term effect, what effects it will have on other areas, etc. Nothing worse than if you think you are doing something great but in reality you make it even worse.
The cycle of questions is often interrupted too early. The real cause is then not really eliminated and after some time there are repeated difficulties.
You can test it: If the reverse of your assumptions works, you are probably at the end of the causal chain.
As mentioned in the beginning another way is the ISHIKAWA diagram
Just keep in mind that not like with the ISHIKAWA the 5 Why only leads you to one cause for a problem. But as always in life there can be more than just one that leads to an effect. Therefore, the combination of 5Why and ISHIKAWA gives you the best approach to determine causes. It will allow you to represent several major and minor causes that can contribute to the solution.
Get the big picture with an ISHIKAWA drill it down with the 5Why.

Affinity Diagram
The affinity diagram helps you to organize a large number of ideas into logical categories and natural relations.
So you have a large number of ideas and need to organize them. The affinity diagram is the perfect fit to get the job done and to structure your ideas into their natural relationships. Basically the affinity diagram describes a structured outcome from a brainstorm session. You can use it to generate, organize and consolidate information related to a product or process, complex issues or different problems. After the brainstorming session you should group the ides according to their affinity or similarity. This idea creation method was created in the 1960s by Japanese anthropologist Jiro Kawakita.
When should you use an Affinity Diagram
The typical use of an Affinity Diagram is when you are confronted with many influences or ideas in a state of chaos. Sometimes a problem seems too large or just too complex to understand it at first sight. Or you simply want that the whole team has a common understanding of a topic.
Usually you are confronted with this situation:
After a brainstorming session
When analyzing open questionnaires, such as survey results
When collecting and organizing large sets of data
When trying to develop relationships between different ideas
Or trying to reduce input to a higher level of categories
Typical process of developing an Affinity Diagram
The Affinity Diagram process gives a group a direction to go beyond normal creative thinking and defines categories to get all thoughts in order. This technique opens the doors and shows relations in between the whole organization which is typically separated due to department silo thinking. The Affinity Diagram has no limits, so don’t be irritated if you have to deal from 20 up to 400 items after a session. It is a starting point not more not less.
Materials needed: Sticky notes or cards, marking pens, and for sure a large surface (wall, table, or floor). Brown paper is a good way to start.
Step 1:
The brainstorming
Write down all ideas on separate sticky notes or cards.
Spread the sticky notes or cards randomly all over the brown paper
Gather all participants around the brown paper after all notes are taken
Hint: Use big markers so it easy to read for everybody from distance. Make key statements on the notes don’t write an essay.
Step 2:
Try to sort all ideas that are related in some way and group them up
Try to find relations between these several ideas
Let the team sort ideas
Try to find 8-10 relation groups
Repeat until all ideas are grouped
It is fully reasonable that there might be an idea staying by itself or that team members will move an already grouped note again to another. If an idea belongs in two groups, make a second sticky note or card.
Hint: In this step it is crucial that there are chats going on, it has to be done in silence. Focus is on sorting and grouping ideas. Headlines are done afterwards! Not upfront!
Step 3:
Open discussion with your team.
Try to find common categories and define headlines for each group together with all team members. Discuss what you see or why members see an idea in a different category. If necessary, make changes and move ideas between categories. In the end, when all ideas are grouped in the consent of the whole team, define the headlines of each group. Try to find a catchy headline that describes the meaning of the category in short.
Hint: Cards with the headline should be in a different color than the rest and should be self explaining about the group.
Step 4:
If reasonable, try to define “mastergroups” of several “subgroups”.
Sort all ideas to their identified category by placing all ideas under the “headline card”.
Hint: The sorting is done by gut feeling, not with a scientific approach.

SIPOC
SIPOC can be used to clearly define process steps within a process chain.
SIPOC is a > Six Sigma tool that summarizes an entire process at the start of an improvement project. SIPOC can be used to clearly identify process steps within a process chain. A SIPOC diagram is only a snapshot of a process. Each of the letters in SIPOC represent the names of the columns in the table:
S – Supplier, I – Inputs, P – Process, O – Output, C – Customer.
The SIPOC method has its origins in Six-Sigma and is used there in the definition phase of a project. To have it summarized see the following Infographic:

By applying this method, it is possible to quickly gain an overview of all the main elements of a process to be examined, even before more in-depth details are worked out.
SIPOC is a very simple and at the same time very effective method that can also be used in various situations in the lean management context.
Possible applications of a SIPOC can be:
Starting a KAIZEN workshop in order to create a common basic understanding.
To achieve a quick overview (top level) for subsequent process optimization
Simple type of documentation for existing processes
Identification of important process participants (who must attend the KAIZEN workshop)
Definition of the process steps to be investigated within a process chain
How to use SIPOC:
The SIPOC method can be used in many different forms, such as Excel spreadsheets, handwritten tables on flip charts or brownpaper versions using cards or post-it notes.
The easiest way is to start by listing the process steps. No more than 5-7 process steps should be listed, since the SIPOC method is not about carrying out a detailed process analysis, but only about gaining a rough overview.
It often makes sense to note down on the process card those departments or persons who carry out the process for the respective process steps, so that it can be recognized immediately who is responsible for the process.
Input: which input factors are necessary to perform the process step? This could be material, information, machines or a service.
Supplier: who provides these input factors? Do they come from an external supplier or from an internal supplier - perhaps as the output of a previous process step in the process chain?
Output: what is produced as a result in the respective process step. These can be material things such as components, assemblies or finished products, or intangible things such as processed information in the form of a document - e.g. a static calculation or an order confirmation.
Customer: for whom the result was actually produced. Make a distinction between external and internal customers. If no customer is found for the output size, it must be checked whether the process step makes sense at all.

SMED
Single Minute Exchange of Die. A method of increasing the amount of productive time and to reduce the planned downtime to single digit minutes.
Single Minute Exchange of a Die
This series of techniques was invented by Shigeo Shingo to set-up manufacturing equipment in less than 10 minutes. Most of the time people think in one minute but is thought as single digit minutes.
So what is behind the set-up time reduction?
This method is driving to increase the net production time as much as possible by minimizing the needed time to change from one model to another. As far as you have two or more products running on your line or to simply exchange parts of your machine or equipment that regularly needs to be replaced. This is increasing the flexibility of your production and allows you to react on changes in demand more quickly.
When trying to reduce changeover tomes the typical goal is to reach less than 10 minutes. The short summary of SMED activities is to analyze each element of the changeover with the EMIPS method to see if it can be eliminated, modified or moved outside the process, integrated, tasks are parallelized or synchronized.

SMED
When looking at those three stages we can simplify it further for each stage:
Just ask yourself:
Separate:
Can this task, as currently performed, be done while the line is still running?
Convert:
Which process steps can be moved out of the changeover itself and be parallelized or completely taken out? How can you do it?
Synchronize:
How can the remaining tasks be synchronized so you need as little time as possible to complete the changeover?
I save you the story with the pit stop in formula 1 - just google it by yourself and you will find the evolution of pit stops. Quite interesting and still valuable.
So what are the benefits of SMED?
The first effect you will see on improvements of the OEE of your manufacturing facility. If this is important for you and you are numbers driven. In the end you will reduce downtimes and therefore manufacturing costs as your machines will have a greater net operating time.
With a long term perspective SMED will enable you to have smaller batch sizes, which will improve your possibilities to react faster on changes of customer demands and in addition your inventory (tied capital) and WIP (work in progress) will decrease.

PPM
The PPM rate (Defect Parts per Million) indicates how many NOT OK parts have occurred per million parts delivered or produced.
Parts per million or also known as Defect Parts per Million
The PPM rate (Defect Parts per Million) shows how many NOK parts have been produced or occurred with one million parts produced or delivered. Rates can be categorized into two main processes. Lower rate on processes where defects can be easily found and higher rate on processes where defects are mainly hidden, e.g. the structure on casted parts. The PPM rate is mainly used to determine the quality capability of deliveries of manufacturing goods.
Thinking about the automotive industry with the SOP (Start of Production) there are still many failures and defects in the process and those must be eliminated through continuous improvement (CIP) measures. In order to take the customer wishes into account, PPM rates are implemented as KPIs to see the progress of your actions concerning the reduction of those defects.
If you are dealing with the automotive industry you will find a lot of PPM regulations and they are often misused as a source of income. OEMs will give you penalties for exceeding the PPM rate, this is a very common approach. Small and mid-sized companies typically sign some sort of quality agreement with OEMs or their customer, Tier 3 up to Tier 1, this is sort of a framework for PPM rates for manufacturing processes throughout the complete value stream of production.
If you have your customer knocking at your door and asking for a PPM regulation, make sure to categorize your production into major fields of operation such as casting, molding, machining, etc. Or if you have dedicated manufacturing lines for your customer try to focus on the end of line quality check and agree on which ratio is acceptable and which not. Don’t go in the details, this will only give you a higher risk of screwing it up and a wider area of attack. And finally try to agree realistic PPM rates, nothing worse than promising something you already know you can’t achieve.
Just to make sure you got this, the way PPM will be evaluated depends on the criteria defined between you and your customers. E.g. agree on with how many non-conforming parts an entire delivery will be rejected.
Until know we looked on it as supplier, so let us change perspective and see it from customer point of view.
Supplier evaluation includes several performance measures in order to compare them and rank them properly. The PPM rate is the most meaningful evaluation to asses the quality among your suppliers. In addition to the PPM rate the number of complaints and costs per defect can be included as evaluation criteria. Specially in the automotive industry there are several rules and regulations but key is certification. You can make sure that your supplier follows several rules by being certified after standard norms, just think about EN ISO XXXX. Even when the certification process can be seen as complete waste of time and money, in the end you know that the suppliers know the rules of the game.
So what to do when the PPM rate is exceeding the agreed limit. First of all your quality management should step in. As customer I would ask for an 8D report, of course depending on the failure rate. Therefore again, agree what limits you will have and at what limit what actions will be necessary. It might also be that you will demand from your supplier to immediately conduct a sorting action.
What ever it is or you will work on make sure to follow a structured approach to successfully tackle the PPM rate. For this we recommend to read the PDCA article or the A3 article. No worries there is more that you can do but in the end problem solving in all the cases always follows the PDCA cycle.
The PPM rate is also a great example for a KPI that can measure the effect of your improvement or KAIZEN actions. You see it is a versatile KPI that effectively runs your business and shows you if you’re on track.
Stay Connected

Ad
We want information fast and in a nutshell. We from OI recommend Blinkist* - because it’s simply the best.
* = Affiliate Link


