LANGUAGE OF LEAN

FLOW
Flow is one of the key principles of Lean, and it refers to the smooth, uninterrupted progression of work from one step to the next.
Flow is an essential aspect of Lean Management and is closely tied to the value stream of an organization. Lean is a management philosophy that emphasizes the elimination of waste and the creation of value in all areas of a business, from the production floor to the office. Flow is one of the key principles of Lean, and it refers to the smooth, uninterrupted progression of work from one step to the next.
The value stream is the series of activities that a company performs to deliver its products or services to customers. It includes everything from the design and development of a product to the delivery of that product to the customer. The goal of Lean is to optimize the value stream, eliminating waste and ensuring that the flow of work is as efficient as possible.
To achieve flow, Lean experts focus on creating a smooth and continuous flow of work, from the initial stages of design and development to the final stages of delivery and customer service. This requires a deep understanding of the value stream and the identification of any bottlenecks, or areas where work is slowing down or coming to a stop. By removing bottlenecks, Lean experts can increase the speed of work and improve overall efficiency.
One of the key tools used in Lean for optimizing flow is Value Stream Mapping (VSM). VSM is a visual representation of the value stream, showing the flow of work from start to finish, including all the steps involved and the time required for each step. With VSM, Lean experts can identify areas of waste and inefficiency, such as excessive inventory, overprocessing, and wait times.
Another important tool for optimizing flow is Just-In-Time (JIT) manufacturing. JIT is a Lean method that emphasizes the need for production to occur only when it is needed, and no earlier. This helps to eliminate inventory waste and reduces the amount of time spent waiting for parts or materials. JIT also helps to minimize the risks associated with inventory, such as obsolescence, damage, and theft.
Another aspect of flow in Lean is the concept of "pull" production. This means that production should be driven by the demand from customers, rather than by forecasting and forecasting-based production schedules. Pull production helps to ensure that work is only done when it is needed, eliminating the waste associated with overproduction and reducing the risk of obsolescence.
Finally, it's important to understand that flow is not just about efficiency and productivity. It is also about creating a culture of continuous improvement and empowering employees to identify and eliminate waste in their own work. This can be achieved through the use of tools such as Kaizen, a Lean method that encourages employees to identify and suggest improvements to the value stream.
In a nutshell, flow is a critical aspect of Lean Management and is closely tied to the value stream of an organization. By focusing on creating a smooth and continuous flow of work, Lean experts can optimize the value stream, eliminate waste, and improve overall efficiency. Whether through the use of tools such as VSM and JIT, or through a focus on continuous improvement and employee empowerment, flow is a key part of the Lean philosophy and is essential for success in the modern business environment.

JIT
Just-in-Time (JIT) is a manufacturing and inventory control system in which raw materials, components, and finished products are delivered to the production line exactly when they are needed.
Just-in-Time (JIT) is a manufacturing and inventory control system in which raw materials, components, and finished products are delivered to the production line exactly when they are needed. The goal of JIT is to minimize inventory levels and reduce lead times, while maintaining high levels of production efficiency.
JIT is a pull-based system, which means that production is driven by customer demand rather than by a production schedule. This is achieved by using Kanban, a signaling system that alerts the supplier to send more materials or components when the inventory level of a specific item reaches a predetermined minimum level.
The origins of JIT can be traced back to the manufacturing practices of the Toyota Motor Company in the 1950s. It was developed by Taiichi Ohno, an engineer at Toyota, as a response to the inefficiencies he observed in the company's production processes. Ohno recognized that by reducing the amount of inventory and increasing the flow of materials, Toyota could improve its production efficiency and responsiveness to customer demand.
One of the key principles of JIT is the elimination of waste, or "muda" in Japanese. Ohno identified seven types of waste in manufacturing: overproduction, waiting, unnecessary motion, overprocessing, defects, excess inventory, and unused human potential. JIT aims to eliminate these forms of waste by creating a smooth and efficient flow of materials and products through the production process.
JIT also relies on the concept of "one piece flow", which is the production of one item at a time, rather than producing large batches of items. This allows for better control of the production process, as well as the ability to quickly identify and correct any problems that may arise.
Another important aspect of JIT is the use of visual management tools, such as Andon boards and Kanban boards. These tools allow for real-time monitoring of the production process, and can alert workers to potential problems before they become major issues.
JIT also requires a high level of collaboration and communication between suppliers, manufacturers, and customers. This is necessary to ensure that materials and components are delivered to the production line exactly when they are needed, and that finished products are delivered to customers in a timely manner.
JIT has a number of benefits for manufacturers. One of the most significant is that it can help to reduce inventory levels, which can free up valuable floor space, reduce storage costs, and minimize the risk of stockouts. JIT can also help to improve production efficiency by reducing lead times and minimizing downtime caused by waiting for materials or components.
JIT can also help to improve product quality by reducing defects, and increasing the ability to quickly identify and correct any problems that may arise in the production process.
JIT also helps companies to be more responsive to customer demand by reducing lead times and increasing the speed of delivery. This can help to improve customer satisfaction, and increase the chances of repeat business.
JIT also helps companies to be more flexible and adaptable to changes in customer demand. It allows companies to more easily shift production to different products or product lines, which can help to maintain profitability during periods of slow sales.
However, it's worth noting that JIT is not suitable for all industries and companies, it's best applied in companies where the production process is well-defined, the demand is stable and predictable, and the lead times are short. Implementing JIT can also be challenging and requires a significant investment of time and resources to establish an effective system.
Additionally, JIT requires a high level of coordination and communication with suppliers and customers, which can be difficult to achieve. This is particularly true for companies that have a large number of suppliers or customers, or those that operate in

Smoothed Production
Smoothed production is integral for customer satisfaction as it is a part of the ordering and complete fulfillment process. It makes sure that the supply chain capabilities are enough for stable production.
The topic of discussion today will be the so-called smoothed production. It is integral for customer satisfaction as it is a part of the ordering and complete fulfillment process. It makes sure that the supply chain capabilities are enough for stable production.
Smooth production benefits you by having a proper influence on your workplace configuration. It does this by helping to create a stable output with optimized inventory via a pre-condition. This presupposition/pre-condition simplifies your workplace based on the following conditions:
Standardized work processes
One-Piece Flow within the workstation
Complete processing
Stabile customer TAKT TIME
Minimal TAKT TIME loss
Maximum Output
Flexible deployment of workers
Quicker material change
Two-Bin-Principle
The smooth production is structured in the following:
Planning Strategy
Constant lot sizes
Stabile material needs
Fixed production times
Flexible inventories
Fixed timelines
Higher delivery dependability
It is implemented by:
Material flow
Scheduling methods
No part shortages
Pull-principle
Supermarket
Route traffic
Small containers
Warehouse Organization
Full transparency
Minimal warehouse levels
Set assembly
Bar codes and Data Matrix Codes
You may be asking the question, “but why do we need smooth production?”
It is a well-known fact that smooth production has many veritable advantages. With that said, there are also some potential drawbacks, but those can be eliminated or at the very least mitigated in the implementation phase.
Here are some of the benefits and drawbacks of smooth production:

The next question you might be asking is, “how does one implement smooth production?”.
Following are some of the requirements for smooth production:
Variable worker allocations should be the basis for the production power of the system. The variable shift models are first optimized for maximum output and then implemented specifically.
Two factors determine the minimum inventory of safety stock for a part number. The first is the variability in customer ordering habits. The second factor is the degree to which the program is successful in the production line. To hit the right spot between these two factors will require systematic optimization with the help of a mathematical model.
To determine what the maximum inventory of each part number should be, we should look at the delivery cycle of that said part number. This is essential for weekly pick-ups or delivery.
The production equipment inventory should be in accordance with necessary tool changes and set-up times.
The weekly production plan should be consistently released to the concerned parties once the production macro planning has been finished.
An information board at the assembly areas will contain all the planned orders.
The material requirement determination should solely be on the basis of the production plan.
Assembly areas should be designated for the online measurement of production units. A data matrix system should be implemented for reducing errors in the documentation process.
The ability to control production is a must if there are any noticeable short-term reactions arising due to discrepancies between the expected outcome and the actual outcome of the production plan.
Any daily deviations must be dealt with proper countermeasures. The production plan must be flexible enough to allow time to deal with backlogs. Meeting shipping deadlines is the primary goal.
A time-saving approach must be implemented in moving full racks from assembly areas to warehousing.
The requirements of the long-term sales plan should be integrated into the production plan so that production capacities and worker allocation are determined.
It is imperative that order calling and Just-In-Time delivery schedule data be automatically transferred to the resource planing system so that production planning can be done.
The production planning for the system will determine the specific production calendars with your organizations shift models.
All underlying data in the system must contain related shipping dates or the dates can be transferred from the demand data as well.
To control the complete system, the updated inventory trend with planned shipping dates, for example, weekly and monthly, should be represented graphically.
All possible scenarios should be simulated, because it is important to determine optimum capacities, performance, etc. for universal or shared production areas.
So, what factors make smooth production successful?
The two factors are planned output realization and controlling of supply
Production plan fulfillment as a part of planned output realization (source: Information board at production area as part of shop floor mgt)
Performance grading of workers in the production area that is done on the basis of the number of Dollars created in exchange for optimal material usability and worker effort (whether overtime or temporary workers)
Material usability of purchased parts, WIP, and raw materials when assembly time bears the cost or parts become short (Source: Information board at production area as part of shop floor mgt)
Special trips for the respective assembly area as a truthful Dollar figure
Supply capabilities and service grade for finished goods are measured using the number of delivered parts and the number of delivery dates met as a result of customer requests when demand data is transferred. (Source: Information board at production area as part of shop floor mgt)
Alternative measures for the success of smooth production:
Usage of constant customer feedback to determine customer satisfaction as used by companies e.g. from the automotive industry
Iterative comparison of customer feedback with important shipping and delivery figures
Target values of no customer feedback are used to get parameters to measure with
With the help of Kaizen workshops in conjunction with the introduction and implementation are used to create optimal basic parameters of success:
The finished goods inventory levels are available transparently to be used as an early warning signal
A minimal failure rate is strived for in the overall process of making sure of data from the production and logistics division
Over-production of products is reduced by ensuring that upstream assemblies are only producing the right amount of product to be used by the downstream processes
With the implementation of workshops, the set-up time can be reduced drastically
Constant reduction of purchase parts does not diminish the availability of the material in the production line while also reducing downtime
Optimal balance is achieved for assembly lines and areas and the requirements are met for variable worker allocation
The specifications of operator qualification shall determine how the qualification and training of workers should be conducted
There has been evidence of improvement in production flexibility in comparison to the past

Coaching
A coach may not be an expert, but they can be regarded as the technical point of contact and are always asked for their opinion and advice.
There is no denying that the abilities of a coachee to perform and learn are enhanced when they are encouraged by a coach to form solutions to the problems which they are confronting. This is exactly what coaching is. A coach may not be an expert, but for sure they can be regarded as the technical point of contact and are asked for their opinion and advice.
It has now become quite common to see supervisors coaching their employees. There can be a five steps procedure been seen in order to define and achieve goals.
At this point I want to recommend the book written by Anne Loehr and Brian Emerson, "A Manager’s Guide to Coaching" demonstrates how managers or supervisors can help their employees enhance their skills and develop themselves without the need for any additional training.
An employee’s success depends on “aptitude, attitude and resources.” Attitude matters most. In fact, a better outlook can make up for shortfalls in skills or materials.

But let us go back to the five steps of the coaching process.
Step 1: Define the target state
In Step 1 we focus on defining the required outcomes. Get the clarity to define goals or future states. It is proven that those individuals who are clear regarding their goals are most likely to achieve them to those who have not defined their goals in a clear manner. Not having well-defined objectives can result in unpleasant side effects, for instance, preoccupying yourself with details. A successful and effective goal must be created by the coachee itself and must concur with their personal values. It is important to make certain goals a bit challenging, as easily achieving results cannot sometimes prove to be less motivating. On the flip side, it is also essential that some goals must have manageable and realistic partial steps so that, in general, it can be considered as achievable.
Step 2: Status Quo
The main aim in the second step is to identify the delta between the current state and the ideal solution within the structure of the current situation analysis. It is also important to assess the psychological and real cost that comes to light, especially when the client is clung to their current situation. Doing this can challenge the client to provide the energy required for the change. With that being said than just a small amount of time must be spent on assessing the Status Quo, and most of the focus must be given to achieving the desired outcomes. You should not expect any solutions at this particular stage.
Step 3: Costs of Opportunity
At this stage, the client needs to develop feelings for their own resources and their possibilities of gaining control of it: "When you feel resourceful, you feel in control, and when you feel in control, you feel confident." The feelings of control are mainly developed on the basis of the knowledge that there are different options and choices. The coach motivates the coachee to identify various options, by which the probability of determining between the non-action and action would already be recognized and appreciated. For the purpose of identifying different options, brainstorming has proven to be extremely helpful. It involves writing everything which crosses your mind regarding the particular subject in a creative and playful manner without evaluating them. The next step involves coachees opting for the options that look more beneficial and effective. These options are then assessed, and their consequences are analyzed concerning various criteria. Because one thing is certain – every option comes at some cost. Make sure that the coachee is willing to pay it.
Step 4: Taking Action
It is time the coachees make their mind as to which one of the options looks better to them that can help them achieve their goal. At this point in time, the role of the coach is to motivate the coachee to state exactly what they intend to do. It must be understood that it is the responsibility of the coachees themselves to execute the individual steps. The duty of the coach is to identify the signals from the coachee that shows resistance. In such scenarios, it is helpful to refer back to the first stage of outcomes for the purpose of confirming whether the objective and goal is extremely unrealistic or obscure.
Step 5: Review
By assenting to review the plan of action after a certain period of time, a little bit of pressure is applied on the coachee to take action. The critical thing for the success is the genuine conduct of the review rather than just an announcement. It is essential to take the first step in the near future in order to avoid losing the planned actions in the daily activities of the business. For that reason, the momentum for the forthcoming actions can stay consistent. The senior-level personnel or the coach can take help of the review in order to keep the obligation and track the coachee's progress and can also regard it as, for instance, for their own superior. The coach ultimately continues to maintain control, and the coachees becomes capable of achieving clarity regarding their own activities.
Deviation Management
Deviation mgmt. is the ability to identify any disruption to the standard work process and to implement effective counter measures on time.
Deviation Management is simply said the pure ability to identify deviation of a process according to the standard work process and you have a structured approach to tackle that issue.
5 Reasons to work with Deviation Management
Improve compliance and ownership of defective goods or processes
Continuous feedback to operators and staff of their deviations
Structured process for deviation documentation, tracking of counter measures and problem solving
Prioritization of improvement measures
Data collection to engage external suppliers and customers
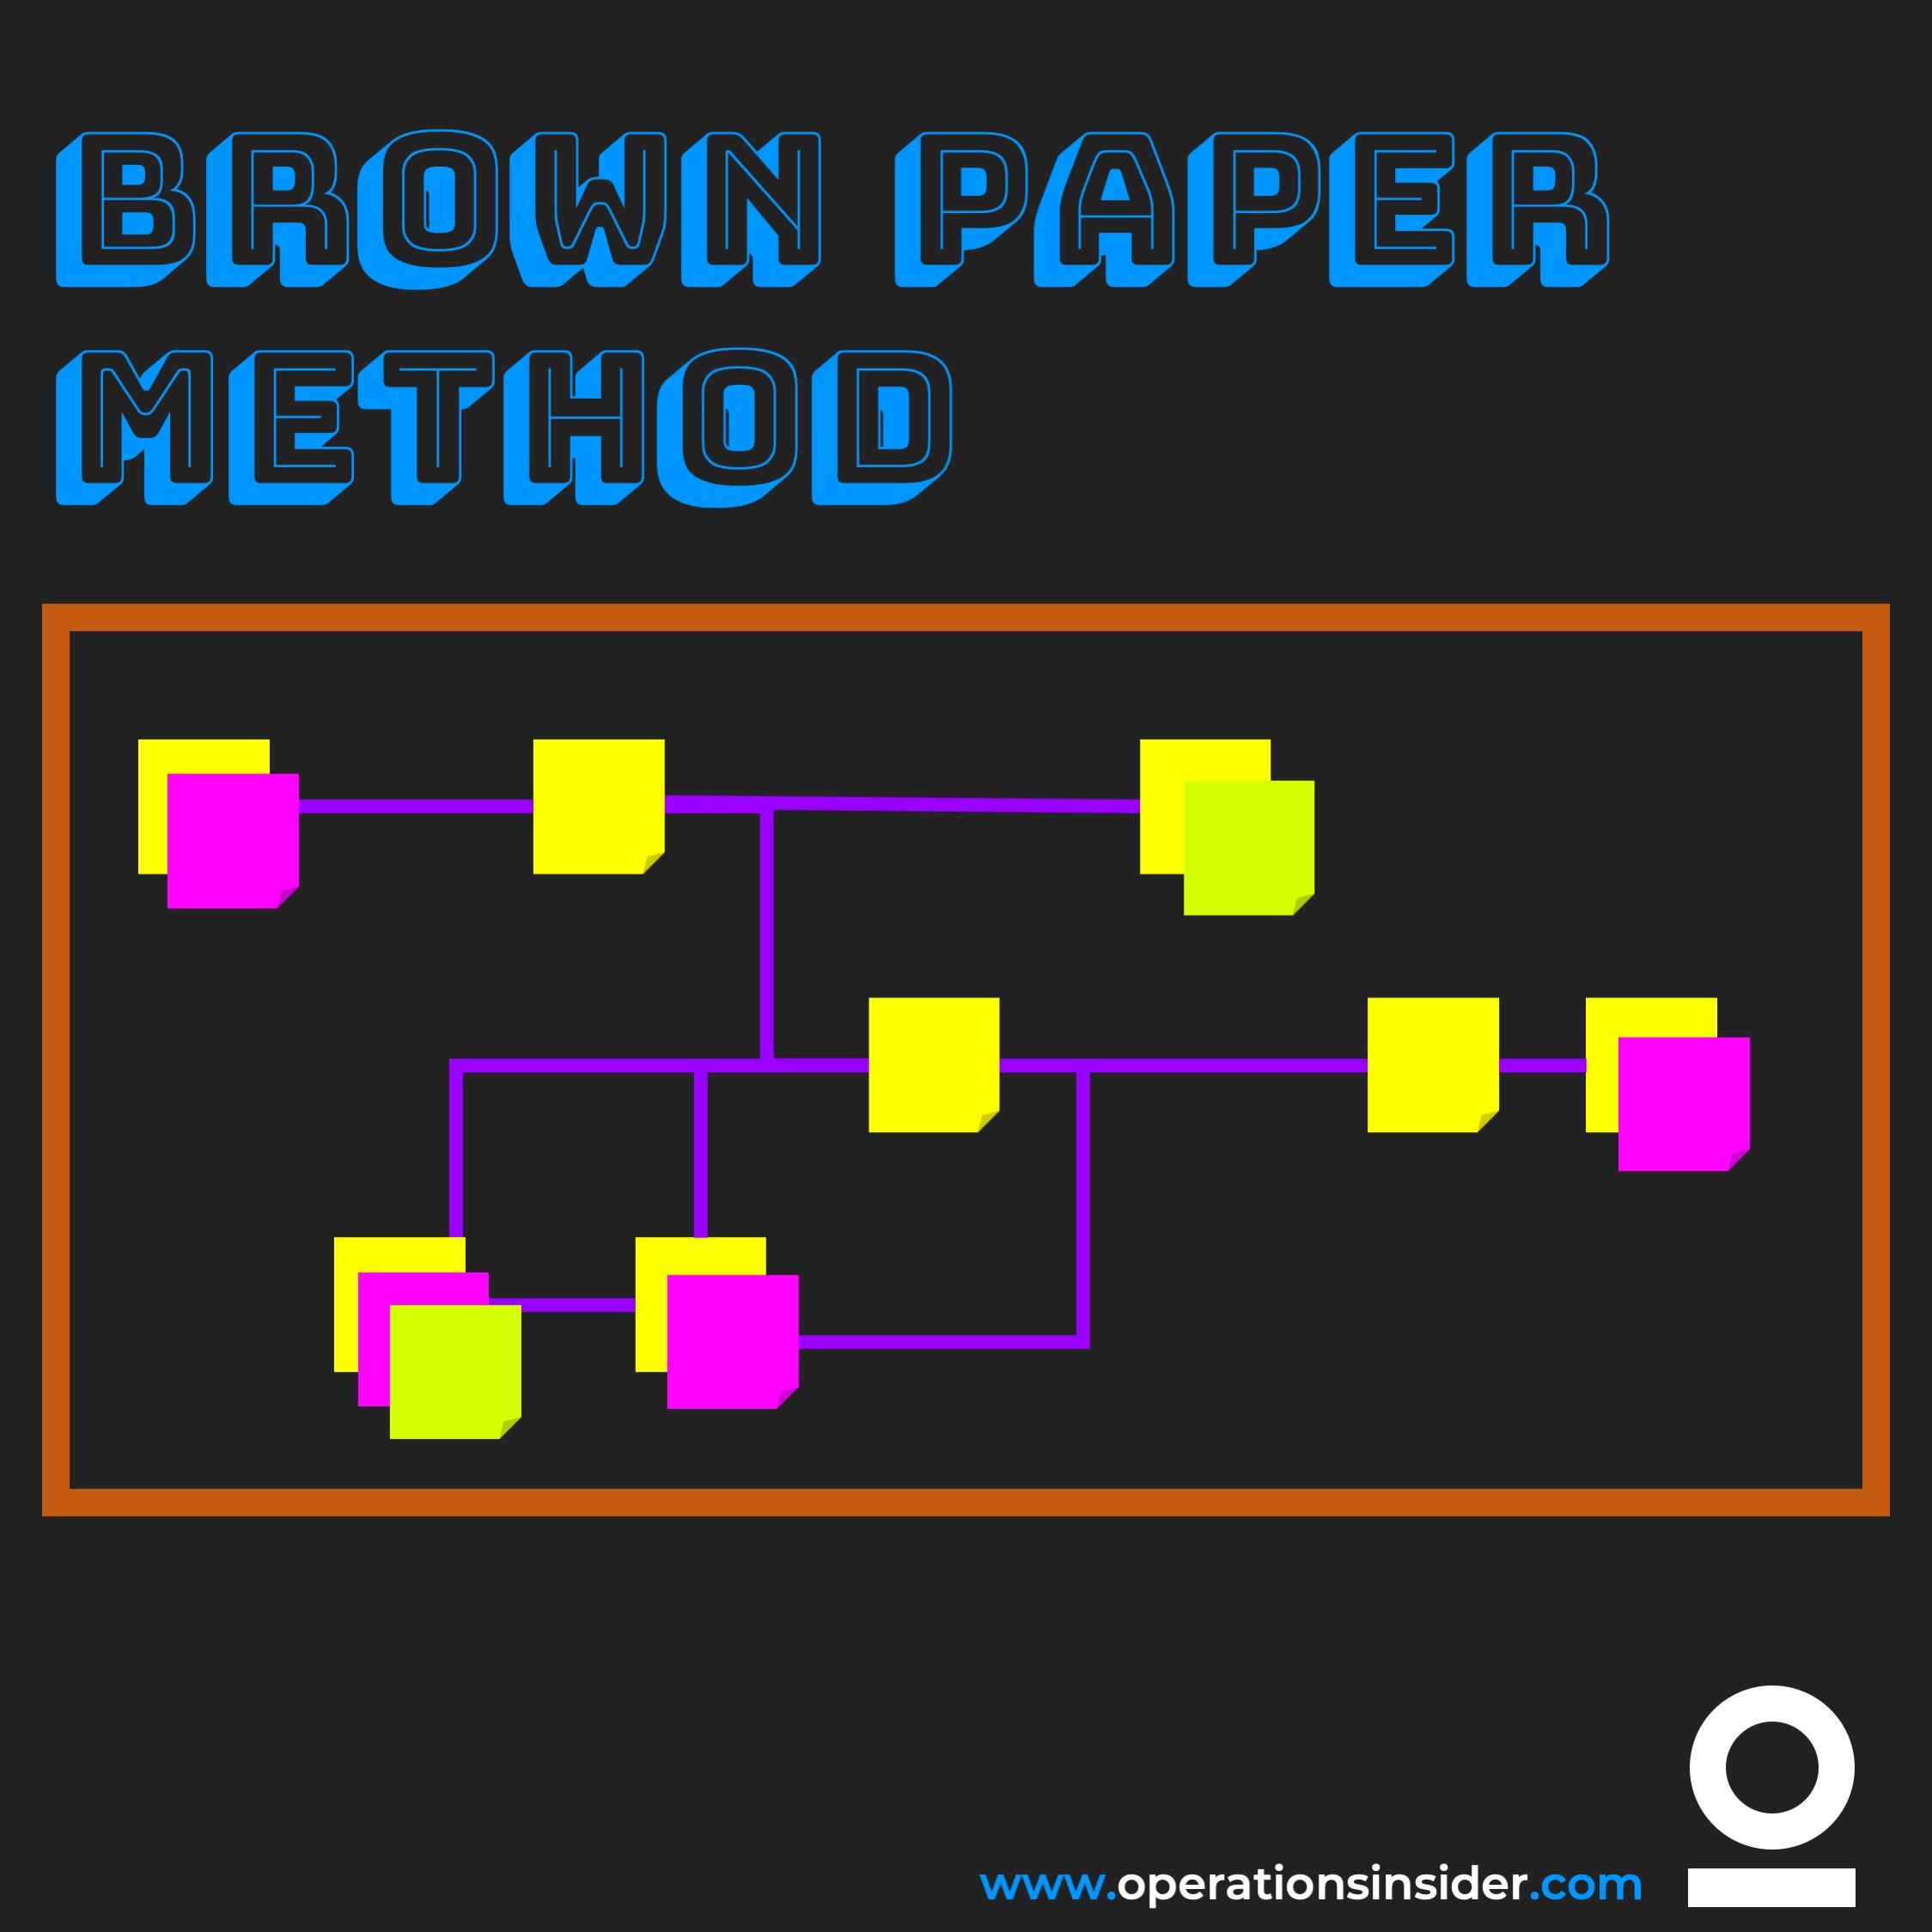
Brown Paper Method
The Brown Paper Method is a practical tool to develop or improve process management in your organization.
What is the Brown Paper Method?
In this article we want to talk about the Brown Paper Method (BPM) in the context of process management.
The Brown Paper Method is an easy to use tool for process development or management for your organization. During a workshop processes are drawn on a large piece of paper (typically from big brown paper roll sticked to a wall) and then analyzed.
Important: Draw the process as they really are not as you think the are. Do a Gemba Walk before this session.
So let us take it as a tool for process management. To be able to understand processes and procedures in your organization and to find out the weak points of them, it is depending on details. Getting those details can be tricky as they might be hidden in the process or in your employees minds and not always so obvious. As mentioned take the Gemba Walks and have a close look on the processes because it usually comes with a taste of complexity. With the Brown Paper Method you then have a simple tool to visualize the complexity in a simply way.
The Brown Paper Method is a pragmatic and result-oriented approach for process audits, presentations or analysis. It is based on a workshop where all involved persons of a process come together in person and collect their findings and doings on brown paper and draw the big picture of the process in total. Through the discussions, that will appear during the workshop, details will be pointed out that matter and defects or weakness will be described and visualized.
With the BPM, the actual process is collected, visualized and analyzed. Target processes can be also developed together. With the Big Picture of the process on brown paper all becomes clear for those involved and the tricky parts of the process are worked out and presented.
Based on the findings of the initial workshop the results are taken to the next level of process modeling. This includes the definition of the target process, implementation of automated workflows and process optimizations.
The process representation on the wall covered with brown paper can contain the following process characteristics:
What triggers and ends the process
Single process steps
Events
Suppliers and customers
KPIs can be important for the process flow (Defect rates, process times, etc.)
Process Input such as raw material, semi finished goods, pre-assemblies, toolings but also information and data such as reports or KPIs
Output and outcome such as finished goods or services
Employees actually executing process steps in the process flow
Employees that have an indirect influence on the process
Other teams or departments related to the process
and so on…
For the upcoming analysis following parts of the brown paper are discussed, additional information added and highlighted:
Critical activities that have a direct impact on the final result of the process including costs and time
Missing or missleading inputs such as information or defective parts
Wrong process steps that are distort the result
Incorrect or missing process step outputs
All potential to improve the process e.g. Kaizen activities marked with a KAIZEN flash
Which of these characteristics finally are listed in the process representation is up to the team as well as the weighting of each. This will then prioritize the potentials identified and when they will be tackled.

Key Performance Indicator
A method of tracking or monitoring the progress of existing daily management systems.
Key Performance Indicators are measurements utilized to indicate the performance level or progress with regard to important objectives or defined success factors within your organization. To make it short KPIs are used to track or monitor the progress of your existing daily management system.
So how do measure our progress of our organization? How can we define what type of indicators we should use and what they tell us about the current state of our processes? And so on…
These are just some questions that might rise when thinking about implementing KPIs in order to better understand your organization and define a path to go for improvements. What processes are truly adding value to the final product or service the customer is willing to pay for and what is just waste?
Before you start implementing KPIs in your organization a helpful way is to categorize KPIs in two ways: leading and lagging indicators.
Leading Indicators
Leading Indicators are Performance Indicators that are tracking your process. So these are real time figures showing you deviation to given standard or if there is something missing in order to produce your goods or services. They have a real time effect on your delivery performance. The fun part with leading indicators is that you have real time results why it can also take months for a report showing how your organization is doing in general.
For example, talking about injuries, when an operator is involved in an accident during a process step. This incident will be documented on an incident rate report of the organization, for e.g. factory. So when you think about it you recorded an incident after it happened. This is a necessary process in the majority of organizations due to governmental regulations and safety laws. The question to ask is now what do you do with this information? Do you really know what caused it? The information is quite old. This is why the incident report is not a leading indicator but a lagging indicator.
Lagging Indicators
As just mentioned Lagging Indicators are result-oriented, because of this they are shown after something happened. With lagging indicators you react after an amount of time as you are reacting on something that is already in the past. Coming from automotive this is typically a customer claim in the field, you will have a lot of work to do to find out what actually caused the failure, if no proper traceability is installed. Attention: With those failures it is often miss leading that through assumptions symptoms are fight that are not real. Everybody from Task Force Managers to shop floor firefighters knows that. In this case you are not adding any value nor do you implement a sustainable solution.
Having this two categories in mind we can say that the majority of KPIs are lagging indicators. This is not only in the field of manufacturing. The most miss leading assumption thereby is that with Lagging Indicators we get the most information.
But openly asking - isn’t it better to prevent the accident before it happens? This is absolutely speaking for Leading Indicators - and by focusing on Leading Indicators your focus in daily operation will shift to your process and not the overall outcome. In fact: when focusing on improving your process as a side effect the overall outcome will increase automatically.
Where to start with KPIs?
First things first - don’t overdo it!
Start to ask yourself what is your daily business? What processes are constantly and repetitive in use? The same principle with Gemba Walks go to your employees and talk to them - ask what is doing well and what not. What can improve their work?
The situation can be daily checked with line reviews or the so called meeting cascade. Where on the lowest level with the shift hand over performance KPIs are reported and issues during the shift are addressed. This figures are then visualized on the e.g. “Cell Board” near the outline of the cell itself. Typically if you have an U-Shape Layout at the spot of raw material and finished goods.
If something goes wrong latest after one shift the focus will be on this process. This automatically prevents new incidents from having a threatening impact. This is the advantage from getting things done right away or afterwards when the game is already over.
Finally to bring it in a nutshell, try to bring your KPIs from lagging into leading. This will shift the focus on the whole organization towards daily processes and improving them with the help of daily Kaizen activities. Measuring the process constantly in real time gives you the opportunity analyze trends and adjust processes to be ahead of the game instead of being surprised by the market.
Analyze your data existing decide what to go for. Implement your KPIs and make sure they go hand in hand with a meeting cascade. This ensures the consistency of data used and that they are actually used to trigger actions. Based on the KPIs you will be able to drive focused improvement actions through shop floor management, visual management, standardized work and structured problem solving.

Hansei
Japanese term meaning to accept your personal responsibility for your own mistakes and the will for improvement. The Hansei Assessment can be seen as deep personal reflection.
The Japanese term of Hansei has the meaning to acknowledge your own mistake(s) and to strive for improvement. The term describes your personal ability of reflection and will to do better.
Hansei plays a big role when thinking about the continuous improvement process and specially the part of looking back and reflect of what could have gone better or where you as person did come short and have a potential lesson.
At Toyota, Hansei is a fixed part of their production system. The Hansei Assessment is held to have a deep review or personal reflection. Typically these assessments are conducted during milestones or at the end of a project during the lessons learned part. The results are communicated to the whole organization so that all can profit from the knowledge gained from this process. By this you will support your complete organization from repeating mistakes or even improve existing standards in order to prevent this from happening again.
You see Hansei can be seen as a crucial part of the organizational development and as heavy weight components for the continuous improvement process, KAIZEN activities and standardized work, as in the end it is up to humans to run your organization and we all make mistakes we can learn from.
In a Hansei assessment you have 4 Elements to analyze and the questions to find an answer.
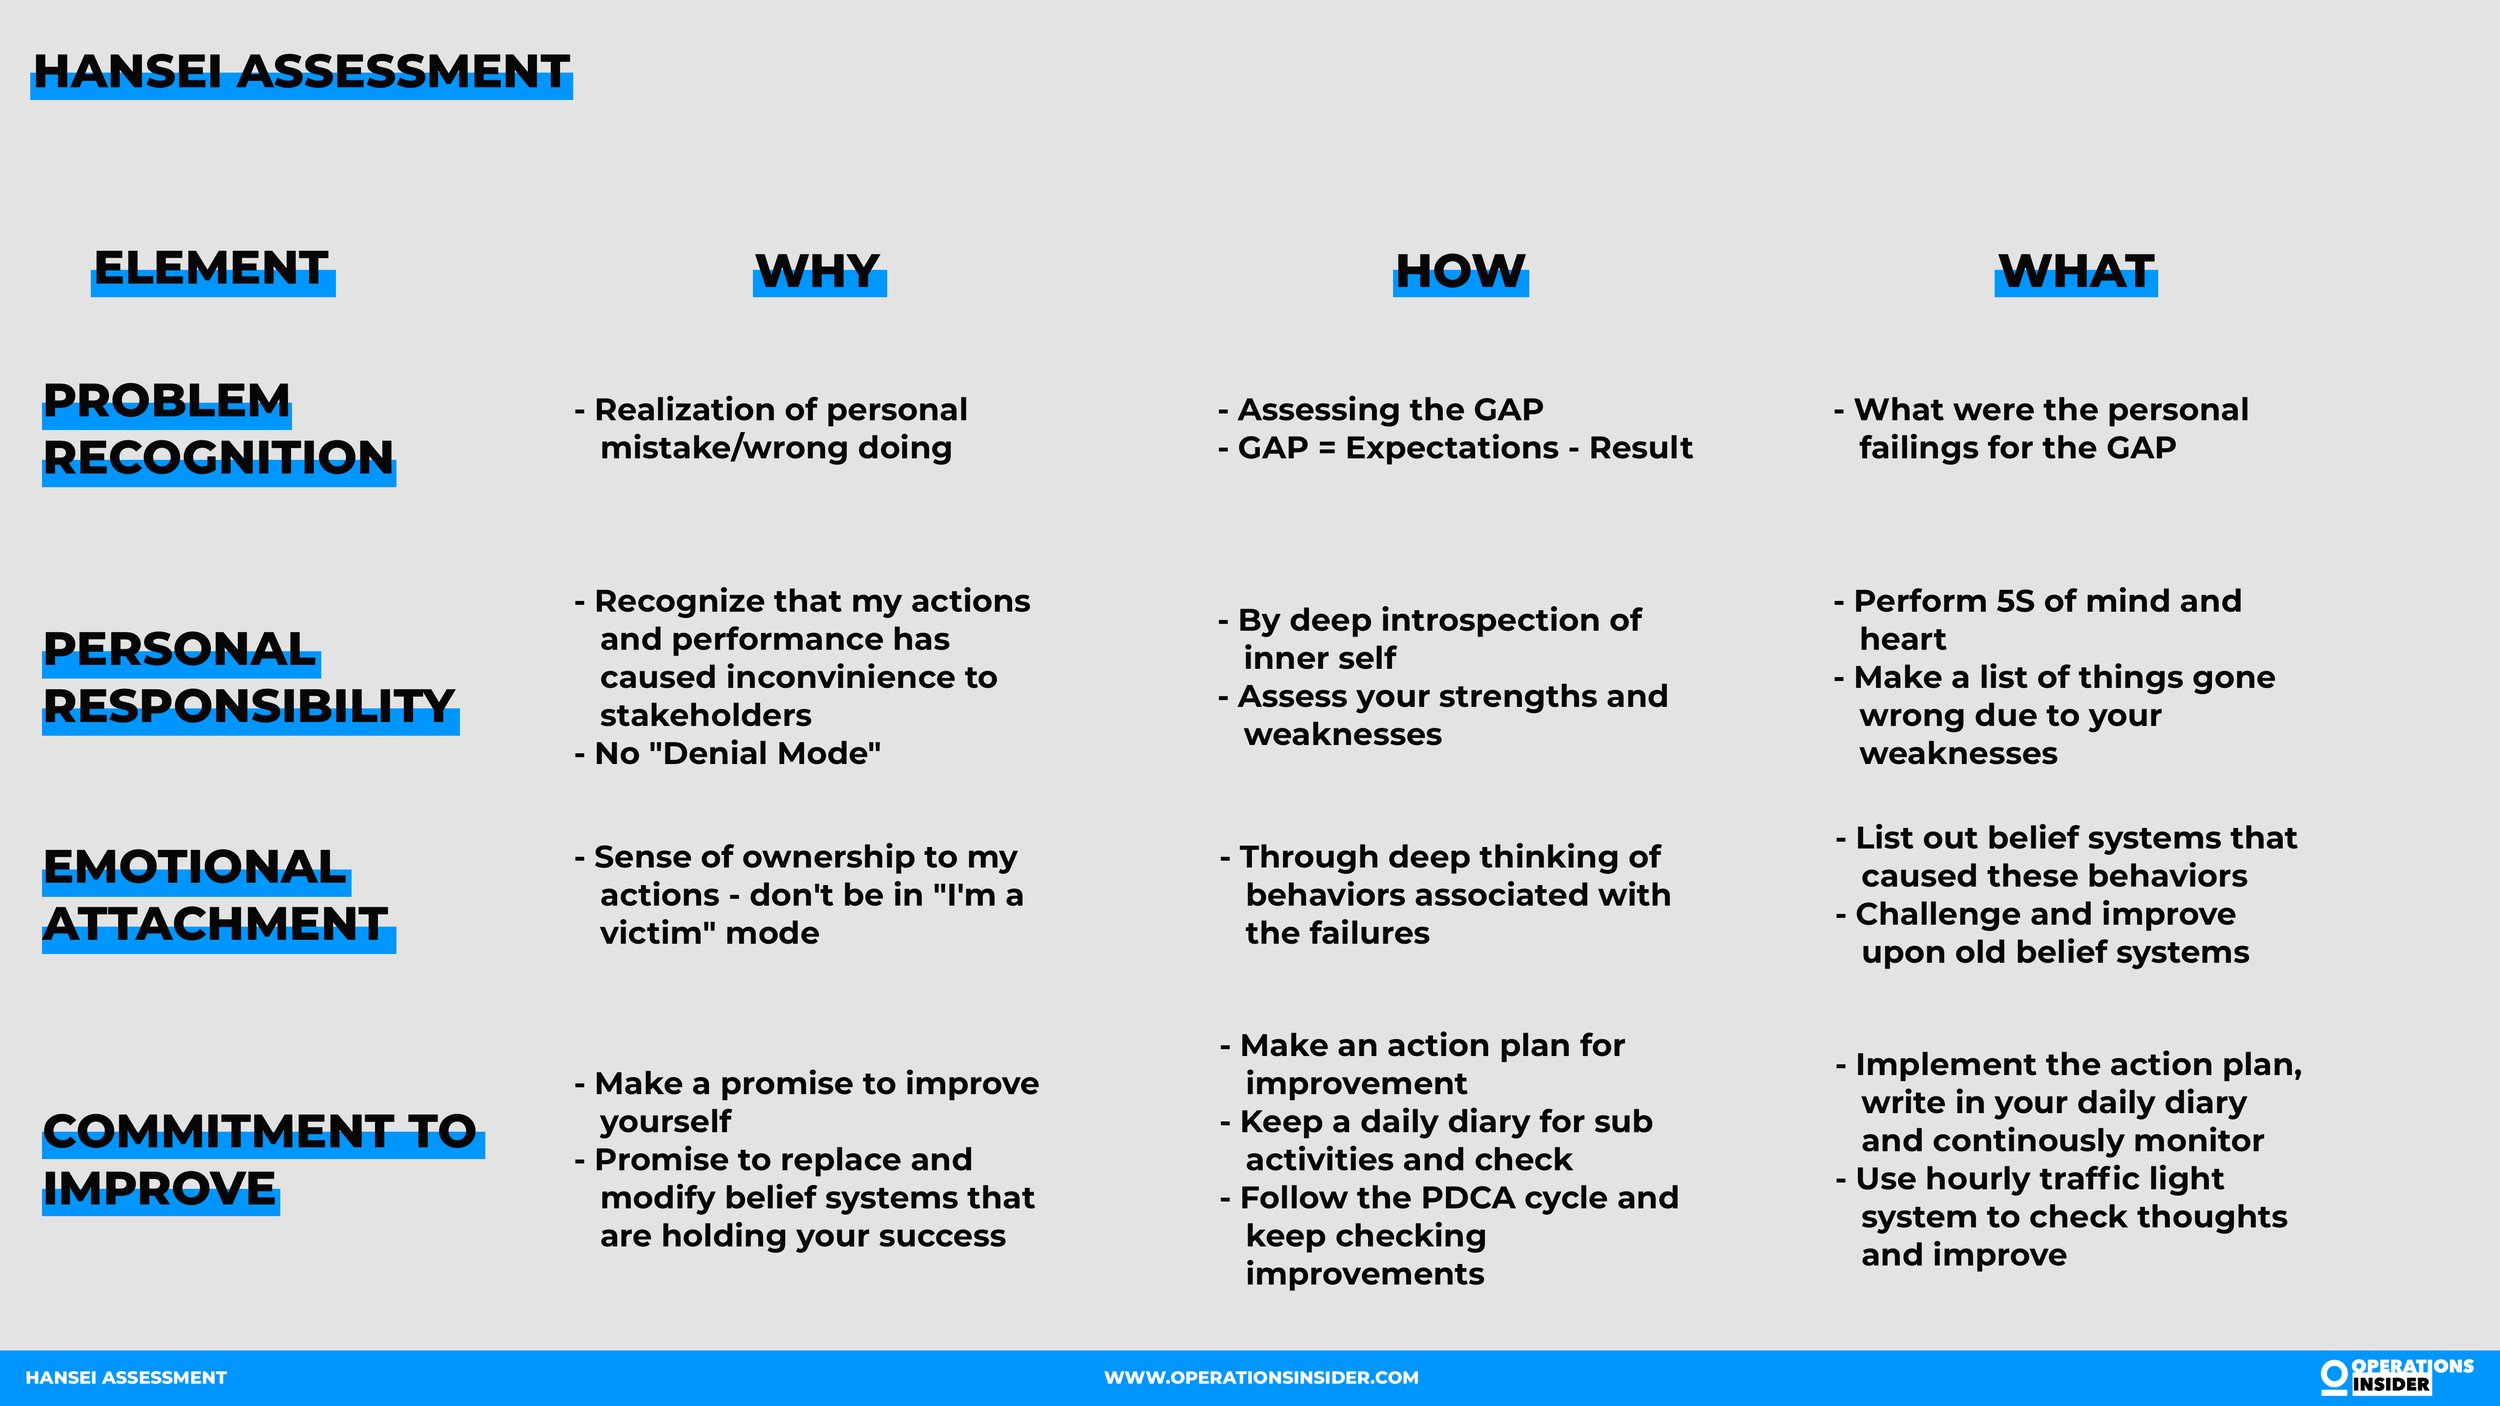
Hansei Assessment

Andon
Andon is a crucial part of visual management on the shop floor that gives a signal that indicates if and where there is a problem.
Andon is a crucial part for the visual management on the shop floor that gives a signal that indicates if and where there is a problem. Typically indicated with a traffic light signal red = failure mode, yellow = non-conforming performance and green = normal operation mode.
The methodology of Andon as part of the shop floor management, is to show the current operating status of a machine or a production line in a way that everyone can see and understand it immediately. As typically in Lean Terms Andon comes from the Japanese language and means paper lamp or just lamp.
Going along the Andon-Systematic there is to mention the Andon-Cords. The cords are used by operators to activate the lamps by either tear the cord or more likely nowadays pressing the corresponding buttons, which are attached above the production line and are easily accessible for the operators hanging downwards or as button attached at the work station.
If a non-conforming condition occurs, the yellow Andon signal initiates the support so that the problem that has occurred can be remedied immediately with additional supportive functions, such as maintenance. In worst case it is also possible to stop the complete production (red signal) until the problem has been solved or at least suitable countermeasures are in place.
An Andon has three main functions:
Visualization of the operating status of a machine/assembly line
Possibility for the operator to report an non-conforming condition and escalate it using a defined escalation process
Production or belt stop, so that no non-conforming products or components are passed on to the next process step

Old fashion Andon Board
The clear display of the operating states of several workstations was used quite early in the development of the Andon systems. The godfather of the TPS, Taiichi Ohno once described it as followed: "When one looks up, the andon (the line stop indication board) comes into view, showing the location and nature of trouble situations at a glance."
In the course of time, the Andon board has increasingly developed into an information board for all employees involved in the process. They display status information regarding the current situation in production, such as the number of units produced per day or per hour, the degree of delivery reliability to the customer or the cumulated amount of backlog. In this way, all process participants are aware of the current situation and can act accordingly.

Andon Boards nowadays
Stay Connected

Ad
We want information fast and in a nutshell. We from OI recommend Blinkist* - because it’s simply the best.
* = Affiliate Link