LANGUAGE OF LEAN

Point Kaizen
Point Kaizen describes improvement actions concentrated on one workstation = on the spot.
Point Kaizen describes improvement actions concentrated on one workstation = on the spot.
In general, all lean activities are striving to increase the output of your processes by simultaneously increasing the level of quality by shorten lead times and using less resources. But not all lean initiatives are reaching these targets. Typically the cause lies in the lack of clear targets by the management combined with a misinterpretation of kaizen activities and organizational change.
Kaizen is the Japanese term for “change for the better” on a continuous matter. Point Kaizen refers to a compressed focus on one workstation and improvement actions during a few days, where e.g. in the end the station is no more the bottleneck of the line/cell. For many people this is considered as “Lean”, but it is only a small part of the journey to real operational excellence.
As mentioned Point Kaizen is a scheduled event. When you have an own Lean Management Team or Kaizen Manager these are the guys who are in charge for the upcoming days. Once the team is gathered the action starts.
5S all over: Yes! Let’s start! Use the euphoria and sort out, get rid of all unwanted objects. Clean-up and proper arrange tools needed. Install e.g. flow racks following the 2 bin principle to ensure straight material flow. The Kanban System and FIFO can’t be skipped. Once the workstation is transformed - everybody is proud to have been part this lean activity and communicates the success story.
If you continue with Point Kaizen activities you will reach a better performance on each isolated workstation and probably everybody thinks that you have a great lean initiative. But the real long term results are missing out. So why to continue with lean activities?
Take a step back and see what you have so far. With the improvement actions on each workstation you have raised the efficiency of all single steps but didn’t consider the flow of material in between. It might be tiring to put all this effort in and then the management comes along and sees no obvious progress. This is the point when you move from Point Kaizen action to a systematical organizational change. This process is focusing on the underlying targets of the organization, such as raising performance, decreasing lead times, improving quality and making more profit.
The A3 format comes back in the game. Not only the A3-report and A3 problem solving but more the target setting on an A3 format that tells the story of how the targets can be reached by preset measures. Combined with the future state Value Stream Map showing all Kaizen Bursts each representing a Point Kaizen activity. All those measures lead to a future state of material and information flow that drives your organization into new spheres. In the future with the new Value Stream your bottlenecks will shift along this stream and always creating new point kaizen starting points. Bottlenecks by this can be either stocks of material, high process times or a lack of information. All Kaizen activities, no matter concerning material or information flow, are implemented following a prioritized list. You not only will have to reallocate resources, but also actively participate on the process of organizational change. You and your mid-management are in the driving seat, you have to know where your organization is heading, so make sure that you and your management are participating on Kaizen activities.
Point Kaizen is the first brick of the foundation for organizational change. With the systematic identification of bottlenecks, Point Kaizen activities can be planned and conducted. To have quick changes but is still able to deliver, one bottleneck after the other is worked on. Each Point Kaizen delivers one piece of improvement for the overall improvement needed. These superordinate targets are an increased output, reduction of lead times by simultaneously achieving Zero Defects Policy and all this combined with lower labor costs.
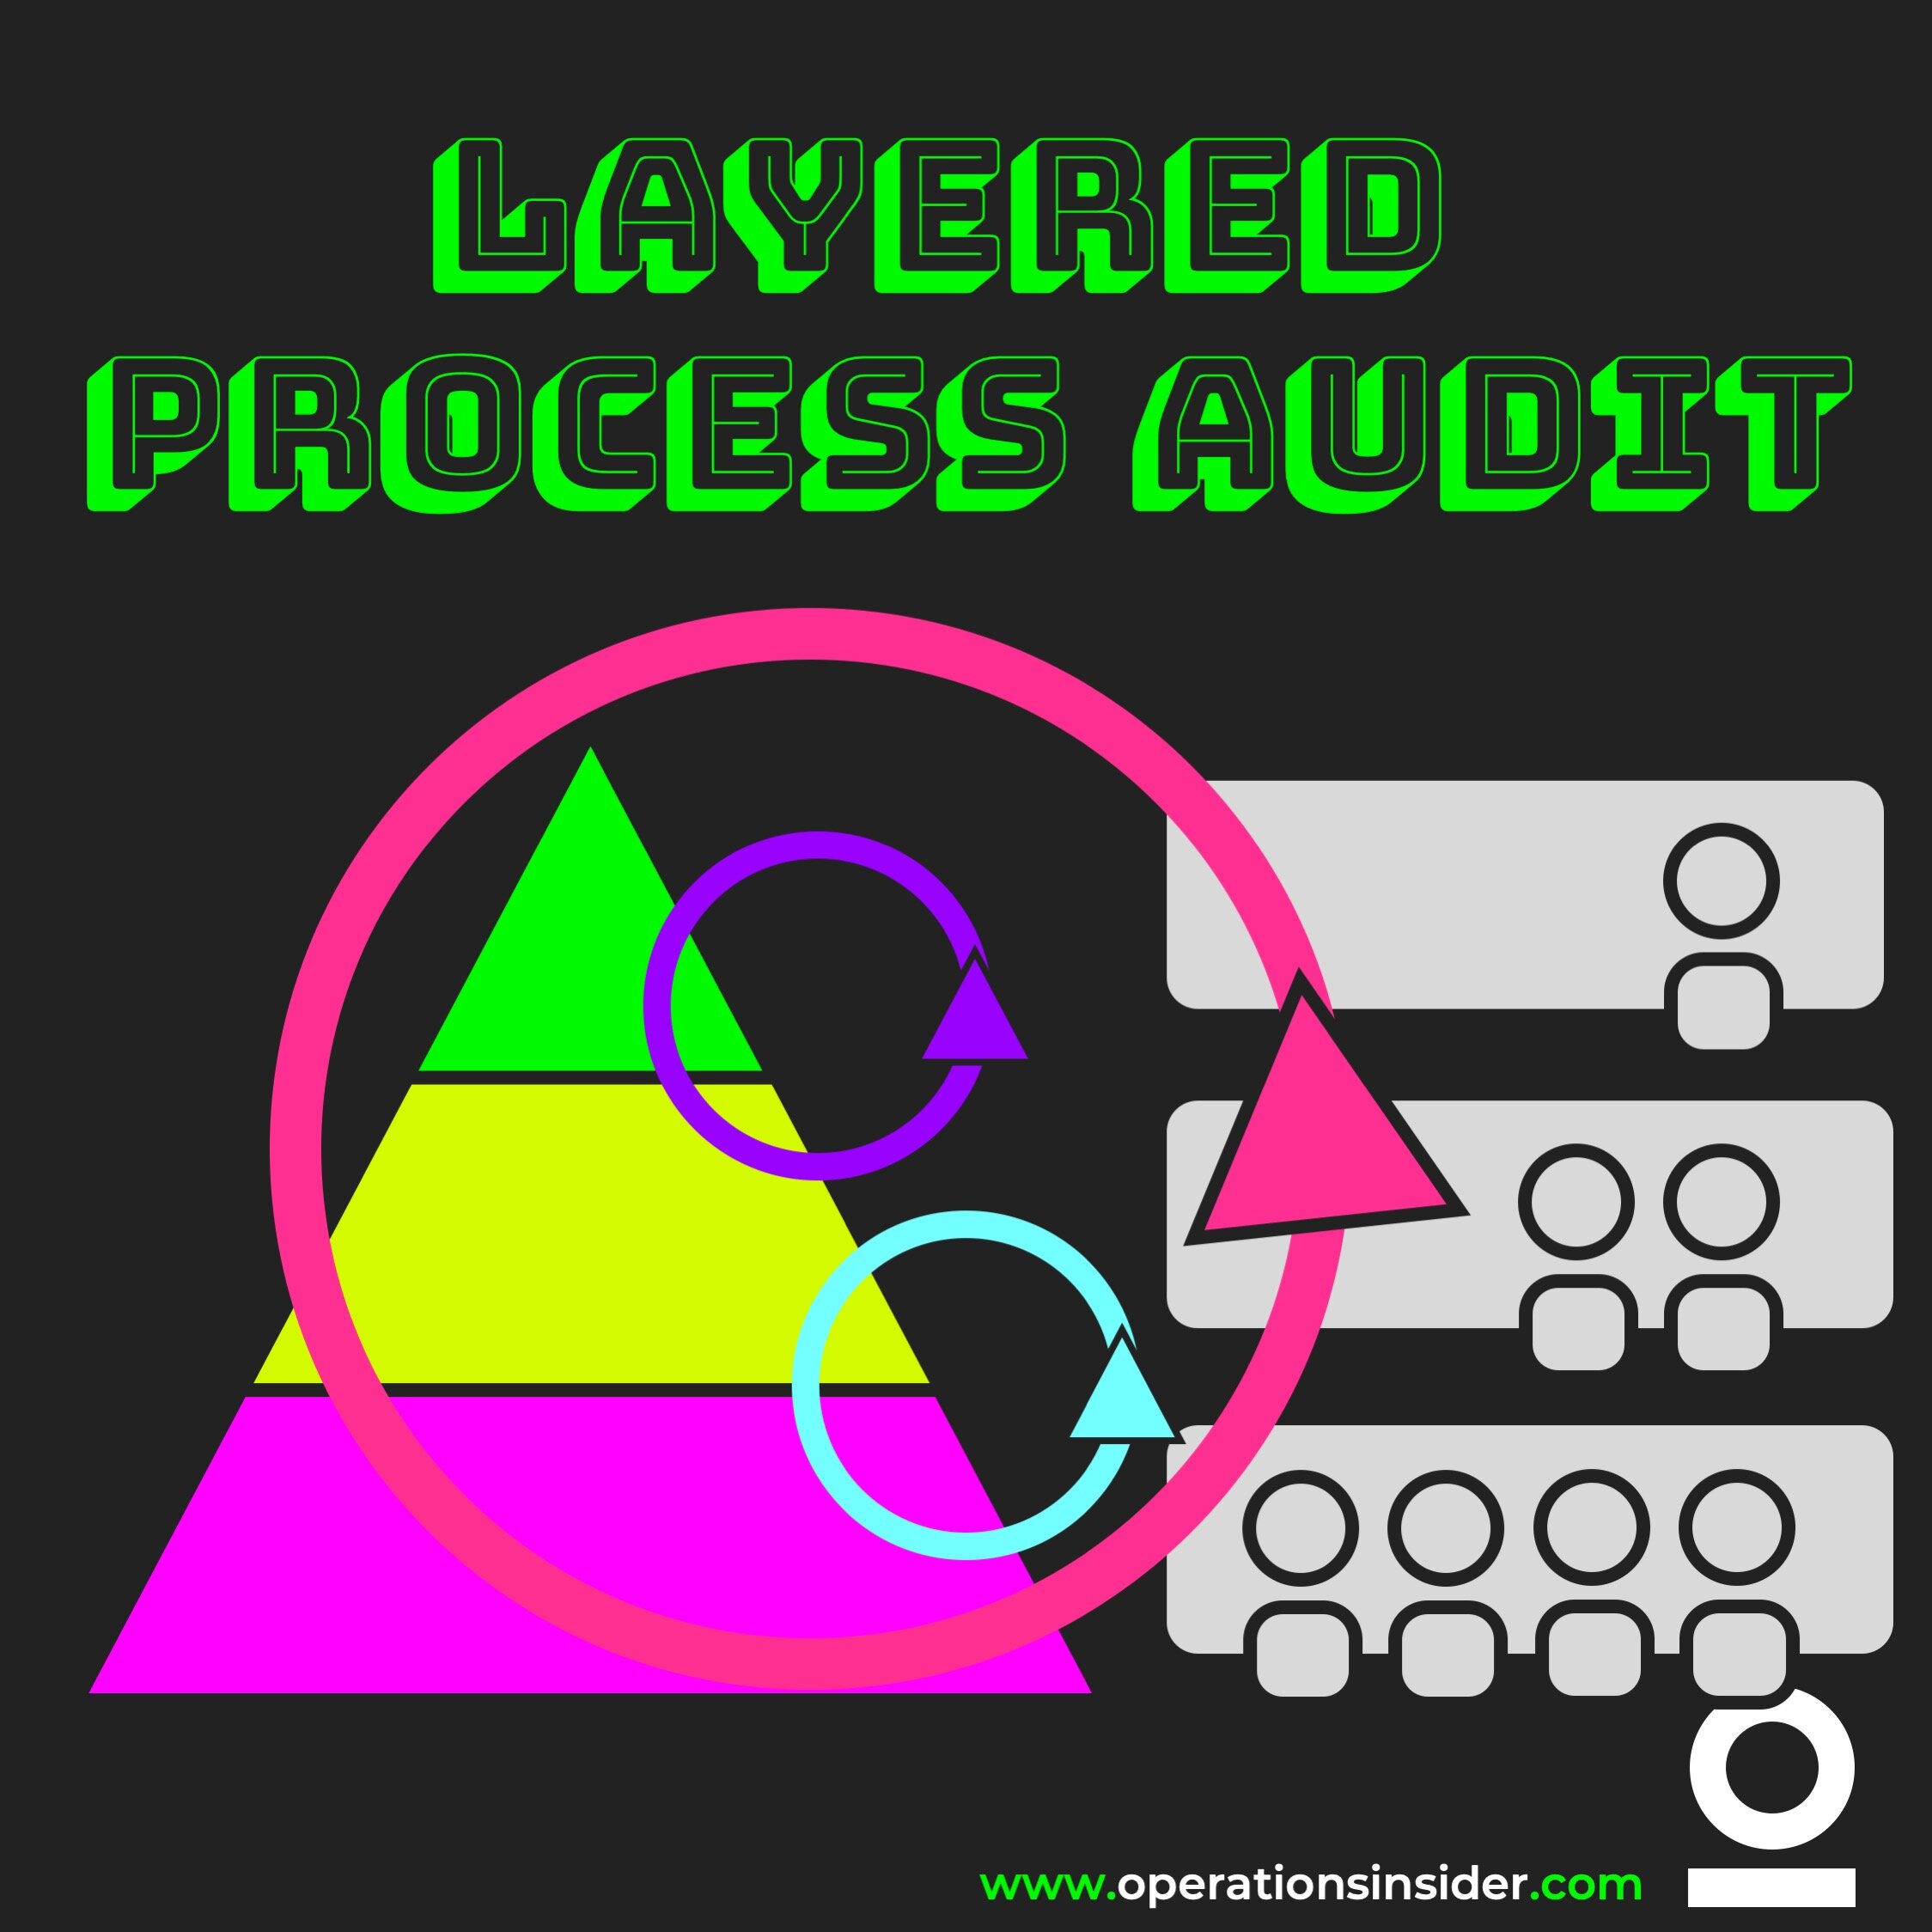
Layered Process Audit
LPA, or Layered Process Auditing, is a quality technique developed for manufacturing management.
Today we will talk about layered process audits.
LPA, or Layered Process Auditing, is a quality technique developed for manufacturing management. When used correctly, LPA brings your organization to improve quality, minimize scrap and rework, plus reduce customer rejections by driving cultural change throughout your company. To gain a better idea and to understand what LPA means we will have a little deep dive.
Layered Audits are a defined approach that devotes time and resources to ensuring that high-risk procedures and error-proofing mechanisms are consistent and functional. Therefore, three important components make up a Layered Process Auditing System:
Full focus on High Risk Processes (HRP) by a list of defined audits
Depending on layer of audit the audit itself is performed from various levels of management
A system of reporting and follow-up to ensure that containment is maintained based on specific needs. But also, to maintain and drive the continuous improvement process in your organization
A full stack of audits
This part of a Layered Process Auditing System is straightforward. Audits are merely a set of questions aimed to investigate machinery or processes. An LPA system's audits should concentrate solely on parts of the value adding process where deviation poses a high risk of producing defective products. E.g. if you have an end of the line quality check station that is measuring crucial parameters or functions that are critical to customers of your product and the calibration is wrong, you are producing in Takt defective or non-conforming products. No need to mention that you should keep an eye on that process. With the help of a proper LPA system you will have the EOL station within the layers allowing containment and corrective action as soon as the station surpasses set tolerances.
Multiple layers of audits comes with multiple layers of auditors
Multiple layers of authority from across your manufacturing department conduct audits on a regular basis, at a predetermined frequency, in an LPA system. For example, once per shift, the Shift Leader conduct an audit that checks the parameters or settings of your EOL-Station. Another layer of management, which may include process engineers, maintenance staff, or even the human resources department, would circulate through the system performing the exact same audit. The sample audit might be performed once a week or once a month by someone in the layer by assigning a number of auditors to this layer and establishing a timetable that cycles through the system's audits. Yet another layer of management, such as the plant manager or even executive staff (the number of levels in an LPA system can vary enormously from facility to facility, depending on your organizations demands and needs). This extra layer of auditors performs the same collection of audits on a rotating schedule, concluding the example audit once a month or once a quarter, for example.
Countermeasures, Containment Actions, Reporting and Improvement Process
In order to have an effective, a Layered Process Audit system you’ll have to combine analysis, measures and improvement process.
If an auditor observes a non-conformance during an audit, the auditor should not only document their findings but also take quick appropriate action to ensure that defective products do not leave the facility. In order to help with the documentation and immediate actions you can use the A3 report and methodology. Simple but effective. You can find it here. Anyway, the findings should be documented and made readily available to management for further analysis. An LPA system is a handy tool for debugging problem areas and identifying areas that are suitable for improvement actions when combined with a strong system for recording and reporting these audit results. A systematic approach will be discussed in the Shop Floor Mgmt. article.
Though Layered Process Audits may be developed to meet a customer or corporate demand, effective LPA systems are built, implemented, managed, accountable to, and owned by your participatory manufacturing management group. A solid LPA system may help you to take proactive control of your manufacturing operations while also enhancing product quality and business bottom line.

Visual Management
How visual management can help you to keep the overview of your operations.
Hej there! Great to have you back! In this article we want to show how visual management can help you to keep track in daily operations.
Generally speaking Lean Management can be seen as a clearly organized workflow that defines the way your organization should work following given principles. Above all principles existing lies to avoid waste in any kind following the 5S Principle as foundation: 1 Sort out 2 Set in order 3 Shine 4 Standardize 5 Sustain.

For a clear visualization of running process in your organization, cleanliness and orderliness is the main part of it. Clarity of your processes on the shop floor is the foundation for all lean manufacturing activities. Having the clarity the implementation and maintaining of visual management methods will guide you to a real state of flow.
In the following we want to describe key basic visual management elements that every production, following the lean principles, should have.
Boards, Notes, Infographics, Brochures and even Movies
Don’t panic and try to explain all those Japanese words it works well without being too technical. Many instruments of the Lean Manufacturing Methodology are very useful to raise the awareness of your employees about lean management. Once implemented and continuously driven by the management the incentives are there to drive daily improvement measures.
The target with visual management and those methods are all the same:
Create transparency
Visual representation of procedures processes and services
Making problems (or bottlenecks) visible
Kanban Boards
Kanban can be literally translated as “card” in the context of a production system. No matter what processes you have, it all starts with a customer’s order. The Kanban card is then used to inform upstream processes about the need of materials, pre-assemblies or process steps. This automatically leads to a cycle that triggers itself through the complete value creation chain.
This is the so called pull principle the advantage if this principle is that, in best case, you have no work in progress which means you have no stock of semi finished goods built up, because only what the following process steps need is produced.
A3 Reports
The term A3 Report comes simply from the size of paper which is used for the documentation of the report. The structure itself follows the PDCA methodology.
The A3 Report is the representation of a problem to be solved. In this case the responsible person from the quality department takes the A3 Report, starts the problem solving actions and follows a systematic structure that makes it possible to describe the effects that are currently leading to a deviation from the standard. Using the A3 only makes sense when you don’t know the root cause yet. If you already know the root cause don’t waste your time. Fix it and go back to normal.
Andon: Lean management with boards and ripcords.
Andon again a Japanese word meaning “lantern”, at least in the context with lean manufacturing. It is a visual aid that is there to draw attention to problems on the shop floor when machines or processes are causing defects or simply stop working.
You might think you have seen them all by walking through production and seeing all those PLC signal lamps indicating green or red, but there is so much more. Just have a look at the Andon article.
Just want to name administration, maybe there is nothing to indicate, but when you think about a document that is needed in a different department, waiting for this is one of the TIMWOODS MUDA. The time waiting is probably the best indicator to start with lean admin activities.
Andon Cords - Please pull the rip cord in an emergency!
Andon Cords are rip cords or a simple button straight at the operation on the shop floor that gives the operator in the process the possibility to instantly stop the line when problems or defects occur.
Andon Boards
Andon Boards are displays or nowadays mainly TV screens that are showing the actual status of the manufacturing line e.g. PPM, down times, etc. Typically it is automatically feeded by the machineries of the production line. With the standard defined color indication everyone sees if they are doing great or not so great. In the second case an automated alert to supervisors or maintenance is triggered.
You see there are many possibilities, but the target is always the same. One hint at the end: Make your boards, infographics or brochures as simple as possible! (or just use mine ;))
WHY? As with processes > it is only a good process when you can’t cut anything more away from it. In other words: What is the value you get from something that nobody understands?
If you take the principle of visual management seriously it will help you to bring all processes in your organization to live.

Pareto Principle
The 80/20 rule demonstrates that things have an unequal distribution. Out of 5 one will fly and have the most impact. With 20 percent of action 80 percent of your target state is already reached.
The Pareto Principle describes that 80% of problems can be closed with 20% of the causes. This principle is named after Vilfredo Pareto who found out that 80% of Italy’s wealth belonged to 20% of the population.
With this in mind it is worth to have a look at it.
Let us start with an assumption, according to the Pareto Principle it allows us to assume that
20% of input creates 80% of the output
20% of customers create 80% of your revenue
20% of causes create 80% of failures
20% of your employees create 80% of sales
and so on…
But before you run away now and think you have the answer hold a second. With the 80/20 rule you might tend to say that it always have to be 100 - it’s not. Make a deep analysis before making such statements! 20% of your employees can also make only 20% of sales or 60%. So before you fire 80% of your employees keep in mind that the Pareto Principle only gives you an idea on the distribution.
The whole idea behind it is that most things in life are not distributed evenly!
When we talk about value adding activities and the final product is 100% What is with all the necessary tasks, that are not adding any value to the final product but have to be done to run the company.
Or think about failures and finding the root cause, where to start to take actions? This is great when you think about a Failure Pareto and you want to satisfy your customer as quick as possible. Of course you are focusing first on the most failures and most of the time - not always - the other failures will disappear as well.
But most important of all, your customer gains trust in you that you have the competencies to do the job.
The key point is that most things are not in a 1/1 actio = reactio relationship.
So what can we use it for this 80/20 rule?
The Pareto Principle in first place supports you on realizing that most of the outcome are based on a minority of inputs. This means:
20% of input creates 80% of the output > try to reduce those non value adding activities
20% of customers create 80% of your revenue > install a key account manager that the customers knows he/she is important to your company > your customers success is your companies success
20% of causes create 80% of failures > Focus on fixing those failures first
20% of your employees create 80% of sales > get those employees a reward
We could continue on and on. To bring it to the point > focus on the 20% and not on everything at the same time.
Some examples that might help you for a better understanding:
Instead of spending a whole night to prepare a presentation and thinking about where to start > focus on one topic and do it. You will get a feedback anyway during the pitch. This feedback gives you the chance to take it and improve it.
Instead of focusing on one solution that might be the best and go through all the details. Make a list of three and go through the pros and cons with your colleagues that probably know the topic better anyway and based on their opinion make a decision with what to go on.
Maybe this examples are nuts for you but we want to emphasize that you should focus only on the important 20% and forget - for the moment - the other 80.
Last but not least - the Pareto Principle is not a law of nature it is a guideline to steer your focus and to save time on problem solving or simply getting your job done faster.

7 Steps - Problem Solving
The 7Steps problem solving is a standard analysis method.
The 7 Steps problem solving is an analysis method that is typically used in the 0miles major customer complaints and warranty complaints: when risk analysis is necessary. The single steps are as follows:
Problem description / risks on similar products and processes
Define containment actions
Data collection (grasping the facts / failure mode analysis)
Identify possible Root Causes
Implement corrective actions
Evaluate effectiveness (Tracking Chart)
Lessons Learned
Root Cause Analysis is one of the crucial and basic requirements in a quality system for continuous improvement. Its target is to recognize a deviation and its origins, resolve the issue so that it is not recurring and improve the quality of the product or processes. Root Cause Analysis always depends on time if you observe a deviation start asap your RCA-activities as no problem should be allowed to grow.
To gain a better understanding let us describe the 7 Steps in more details
1 Problem Description:
Capturing the deviation - Ask the following questions:
What is the problem? (symptom; use illustrations to describe as clear as possible)
Why is it a problem? (content of complaint / definition of problem statement)
Where was it detected? (location of occurrence/Area of the product or process)
When was it detected?
Who detected it?
How was it detected?
How many defective / suspect parts?
Can the problem appear on other products or processes?
Other parts
Generic parts
Opposite hand
2 Define containment actions:
Use a Tracking Chart to list your counter measures
Track how many defective parts have been detected
List in Pareto format what kind of failures have been detected
Put in containment actions and responsible person
Define when the actions have been planned and implemented
Data collection (grasping the facts / failure mode analysis) get and check the valid documentation:
1st part release
Maintenance records
Poka Yoke checks
Process parameters tracking charts
Work Instructions (SOI)
Control Plan
Drawings
Production information
Error collection sheet
First Time Through Report
Boundary sample
Ok part available
Ask the following questions:
Was it the correct process? - How should it be?
Was it the correct tool/fixture?
Was it the correct part?
Has something changed in the process?
Has something changed in the product design?
Is the process in control?
Do all product components meet quality requirements?
Collect pictures, evidences and records to support analysis.
3 Build the ISHIKAWA Diagram
List the problem to be studied in the "head of the fish".
Use an idea-generating technique (e.g., brainstorming) to identify the factors for non-conformance and non-detection within each category that may be affecting the problem and/or effect being studied.
Repeat this procedure with each factor under the category to produce sub-factors. Continue asking, "Why is this happening?" and put additional segments each factor and subsequently under each sub-factor.
Continue until you no longer get useful information
To learn more about the Ishikawa – read this article.
4 Identify the Root Cause
Analyze the results of the Ishikawa after team members agree that an adequate amount of information is provided for each major category. Do this by looking for those items that appear in more than one category. These become the “most likely causes".
For those items identified as the "most likely causes" the team should reach consensus on listing those items in priority order with the first item being the most “probable" cause. A useful method here is to allow each team member to allocate 3 points to their chosen root causes. The root cause with the most points can be taken for further analysis using 5 Why.
Once the most probable causes are drawn explain failure mechanism focusing on 2 aspects:
Cause of non-conformance
Cause of non-detection named
Use the 5 Why method for looking at the problem
5 Possible Actions
Create an action plan with countermeasures for non-conformance and non-detection to eliminate/minimize the effect
Do not forget about due dates and responsible persons (preferable only one person for one action)
6 Evaluate the effectiveness (Tracking Chart)
Put in permanent actions (+ responsibility) and make clear when the action has been planned, implemented and stopped. Track how many defect parts have been detected. After implementation of permanent actions remove containment measures only if there are no defects detected any more.
7 Lessons Learned
Visualize BEFORE and AFTER (KAIZEN REPORT)
Specify what needed to be documented (e.g. Standard Operating Instruction (SOI), etc.)
Grasp what you’ve learned (improvements in working and detection process)
Think about potential applicability in your organization (review similar design, equipment, components, processes, material or manufacturing processes).
Share what you have learned within your organization.
Some of the benefits of the Root Cause Analysis process are that you will identify which procedures will need to be changed, which documents describing those procedures will require modification and who will need to be trained or re-trained.
Finally, don’t forget that the root cause analysis process must lead to an effective corrective and preventive action plan. One without the other would mean that there is no certainty that the issue is solved and that the failure cannot reoccur.
If liked this article give it a thumbs up.

5 Why
The 5 Why methodology is a well known part of the root cause analysis. Key is to ask five times in the row – why?
The 5 Why methodology is a well known part of the root cause analysis. Key is to ask five times in the row – why? It is not the only way to determine the root cause(s) of problems. Just to mention that it usually comes together with an ISHIKAWA analysis. If you want to get deeper into problem solving including ISHIKAWA and 5Why we recommend you the article taking on the 7Steps approach.
The practice of asking why five times in a row whenever a problem occurs supports you on identifying root cause(s) and to determine effective counter measures that are developed through the process of 5Why. Then it is a simple part of PDCA to develop and implement effective measures.
To be able to steer a wide product portfolio, survive the competitive pressure and at the same time satisfying your customers with a high quality product at a reasonable price can be a tough game. Most of the time you don’t have enough time to run the complete product development cycle, do your validation and verification… The end of the story is that you start production because you need to deliver – which automatically leads to mistakes in running daily business. Therefore, the simple method of 5Why can be used to support, not only, your quality department to get faster to the bottom of problems.
The solution for a problem is not always easy, sometimes the root cause is hidden. Therefore the method is an important element of the root cause analysis. One tries to get to the root of the problem step by step with why questions, because one assumes that several causal connections interlock. The system is easy to explain, but there is a lot behind it. If you really take the time to ask the questions carefully and discuss them, the results are extremely profitable.
You should go through these steps of the 5-Why method. Describe your problem as detailed as possible. As more facts you have, you are faster on getting to the bottom of the problem.
What is the difficulty?
When did it first occur?
How often does it occur?
Is this failure randomly coming or reoccurring in a pattern?
Can you repeat the failure?
What is the effect of this failure?
and so on….
It is very important to get a fast idea of the situation on site. Take the Gemba Walk as great opportunity to talk to the people who are actually involved and to see it with your own eyes instead of guessing from your office.
Avoid making assumptions at this stage - you may draw the wrong conclusions.
Keep calm and try to understand the complete context first.
Understanding the context is where the 5-Why method comes in. Gradually ask why questions in order to get a feeling for the interrelationship of effects. This works for many areas of the company, in production, but also in your private life.
Example:
Problem: I miss all the fun part with my kids…
Why do I miss so much? - Because I’m not often at home.
Why am I not often at home? - Because of my position at work I have long working hours and business trips.
Why do I have long working hours and business trips? Because I can’t get my work done in 8 hours and bad in delegating work.
Why can I get my shit done in 8 hours and miss to delegate things? Because I’m sloppy in prioritizing and time management and don’t trust others.
Why can’t I prioritize my activities and don’t trust others? Because I don’t have the information needed to do so.
Reverse conclusion: If I’m not getting the necessary information in a certain amount of time in an acceptable quality I’m not able to steer my employees but also miss the time with my kids.
Sometimes 2 questions are necessary, sometimes 8 or even more to bring you to the “right” conclusion. But don’t give up half way.
Develop appropriate counter measures:
What contributes to solve the problem and who can implement which measures? How long will this take and what consequences will the implementation have?
First: I should try to have set timeframes with my kids which are holy and untouchable.
Second: I should define what information for me is necessary to run my company.
Third: According to the defined Information I train my employees what I need.
Fourth: I implement a clear systematic approach that I have all information latest at 11:00.
(DING DONG - Sounds familiar? BINGO — Shop Floor Management with a functioning meeting cascade.)
Keep the wheel spinning!
No matter what – before start implementing ad-hoc whatever you find best – take your time to identify what actions contribute to a real long term effect, what effects it will have on other areas, etc. Nothing worse than if you think you are doing something great but in reality you make it even worse.
The cycle of questions is often interrupted too early. The real cause is then not really eliminated and after some time there are repeated difficulties.
You can test it: If the reverse of your assumptions works, you are probably at the end of the causal chain.
As mentioned in the beginning another way is the ISHIKAWA diagram
Just keep in mind that not like with the ISHIKAWA the 5 Why only leads you to one cause for a problem. But as always in life there can be more than just one that leads to an effect. Therefore, the combination of 5Why and ISHIKAWA gives you the best approach to determine causes. It will allow you to represent several major and minor causes that can contribute to the solution.
Get the big picture with an ISHIKAWA drill it down with the 5Why.

Affinity Diagram
The affinity diagram helps you to organize a large number of ideas into logical categories and natural relations.
So you have a large number of ideas and need to organize them. The affinity diagram is the perfect fit to get the job done and to structure your ideas into their natural relationships. Basically the affinity diagram describes a structured outcome from a brainstorm session. You can use it to generate, organize and consolidate information related to a product or process, complex issues or different problems. After the brainstorming session you should group the ides according to their affinity or similarity. This idea creation method was created in the 1960s by Japanese anthropologist Jiro Kawakita.
When should you use an Affinity Diagram
The typical use of an Affinity Diagram is when you are confronted with many influences or ideas in a state of chaos. Sometimes a problem seems too large or just too complex to understand it at first sight. Or you simply want that the whole team has a common understanding of a topic.
Usually you are confronted with this situation:
After a brainstorming session
When analyzing open questionnaires, such as survey results
When collecting and organizing large sets of data
When trying to develop relationships between different ideas
Or trying to reduce input to a higher level of categories
Typical process of developing an Affinity Diagram
The Affinity Diagram process gives a group a direction to go beyond normal creative thinking and defines categories to get all thoughts in order. This technique opens the doors and shows relations in between the whole organization which is typically separated due to department silo thinking. The Affinity Diagram has no limits, so don’t be irritated if you have to deal from 20 up to 400 items after a session. It is a starting point not more not less.
Materials needed: Sticky notes or cards, marking pens, and for sure a large surface (wall, table, or floor). Brown paper is a good way to start.
Step 1:
The brainstorming
Write down all ideas on separate sticky notes or cards.
Spread the sticky notes or cards randomly all over the brown paper
Gather all participants around the brown paper after all notes are taken
Hint: Use big markers so it easy to read for everybody from distance. Make key statements on the notes don’t write an essay.
Step 2:
Try to sort all ideas that are related in some way and group them up
Try to find relations between these several ideas
Let the team sort ideas
Try to find 8-10 relation groups
Repeat until all ideas are grouped
It is fully reasonable that there might be an idea staying by itself or that team members will move an already grouped note again to another. If an idea belongs in two groups, make a second sticky note or card.
Hint: In this step it is crucial that there are chats going on, it has to be done in silence. Focus is on sorting and grouping ideas. Headlines are done afterwards! Not upfront!
Step 3:
Open discussion with your team.
Try to find common categories and define headlines for each group together with all team members. Discuss what you see or why members see an idea in a different category. If necessary, make changes and move ideas between categories. In the end, when all ideas are grouped in the consent of the whole team, define the headlines of each group. Try to find a catchy headline that describes the meaning of the category in short.
Hint: Cards with the headline should be in a different color than the rest and should be self explaining about the group.
Step 4:
If reasonable, try to define “mastergroups” of several “subgroups”.
Sort all ideas to their identified category by placing all ideas under the “headline card”.
Hint: The sorting is done by gut feeling, not with a scientific approach.

A3 Report
A3 Report and why it will help in the structure of the PDCA methodology.
The term A3 report comes simply from the size of paper which is used for the documentation of the report. The structure itself follows the PDCA methodology.
In the lean manufacturing world the best known use case of the A3 report is the problem solving report. In this case the responsible person from the quality department takes the A3 report, starts the problem solving actions and follows a systematic structure that makes it possible to describe the effects that are currently leading to a deviation from the standard. Using the A3 only makes sense when you don’t know the root cause yet. If you already know the root cause don’t waste your time. Fix it and go back to normal.

Schematic structure of an A3 report
Let us go through the different stages of an A3:
Describe the problem:
The A3 gives you the chance to initially describe the problem or symptoms - this can be done verbally or as a sketch. Don’t forget to mention when it was and under what circumstances. No matter what it must be easy to understand.
Keep in mind that the target in Lean Mgt. is always to train the people to improve their problem solving skills. Therefore if you are a quality representative try to coach the operators in this process or make a team work out of it.
The result of the description of the problem is the delta from the target state.
Root Cause Analysis:
Please be aware that your paper is only and A3 format. So either you go with an Ishikawa or a 5 Why. But not more. If you can’t conduct a root cause analysis with either on of these methods, the A3 is probably the wrong approach at all.
Counter Measures:
Following the PDCA plan your counter measures what you and your team or operators found out or might think have the most effect.
Lessons Learned:
Great you have done the job, you followed the PDCA and the root cause was found, defined measures helped and the problem is solved. No finalize the A3 report on where to find the documentation and what impact will it have on other operations as lessons learned.
When you are a quality representative using the A3 method ensure that the A3 report is also used for long term development of employees and quality standards.
With the help of the A3 report and a clear coaching through the quality department, all employees learn to recognize, evaluate and solve problems on their own. This is serving the general rule of continuous improvement (CIP)
Therefore the A3 systematic increases the problem solving competencies of your whole organization. And as already said, a problem is only the missing of an idea.
If you want to go deeper on the A3 report itself or the problem solving with the help of A3, we recommend our reading pick “Understanding A3 thinking” this book goes in the details and gives you great insights. Read our summary here. Or you can’t wait? Here is the link straight to the book:

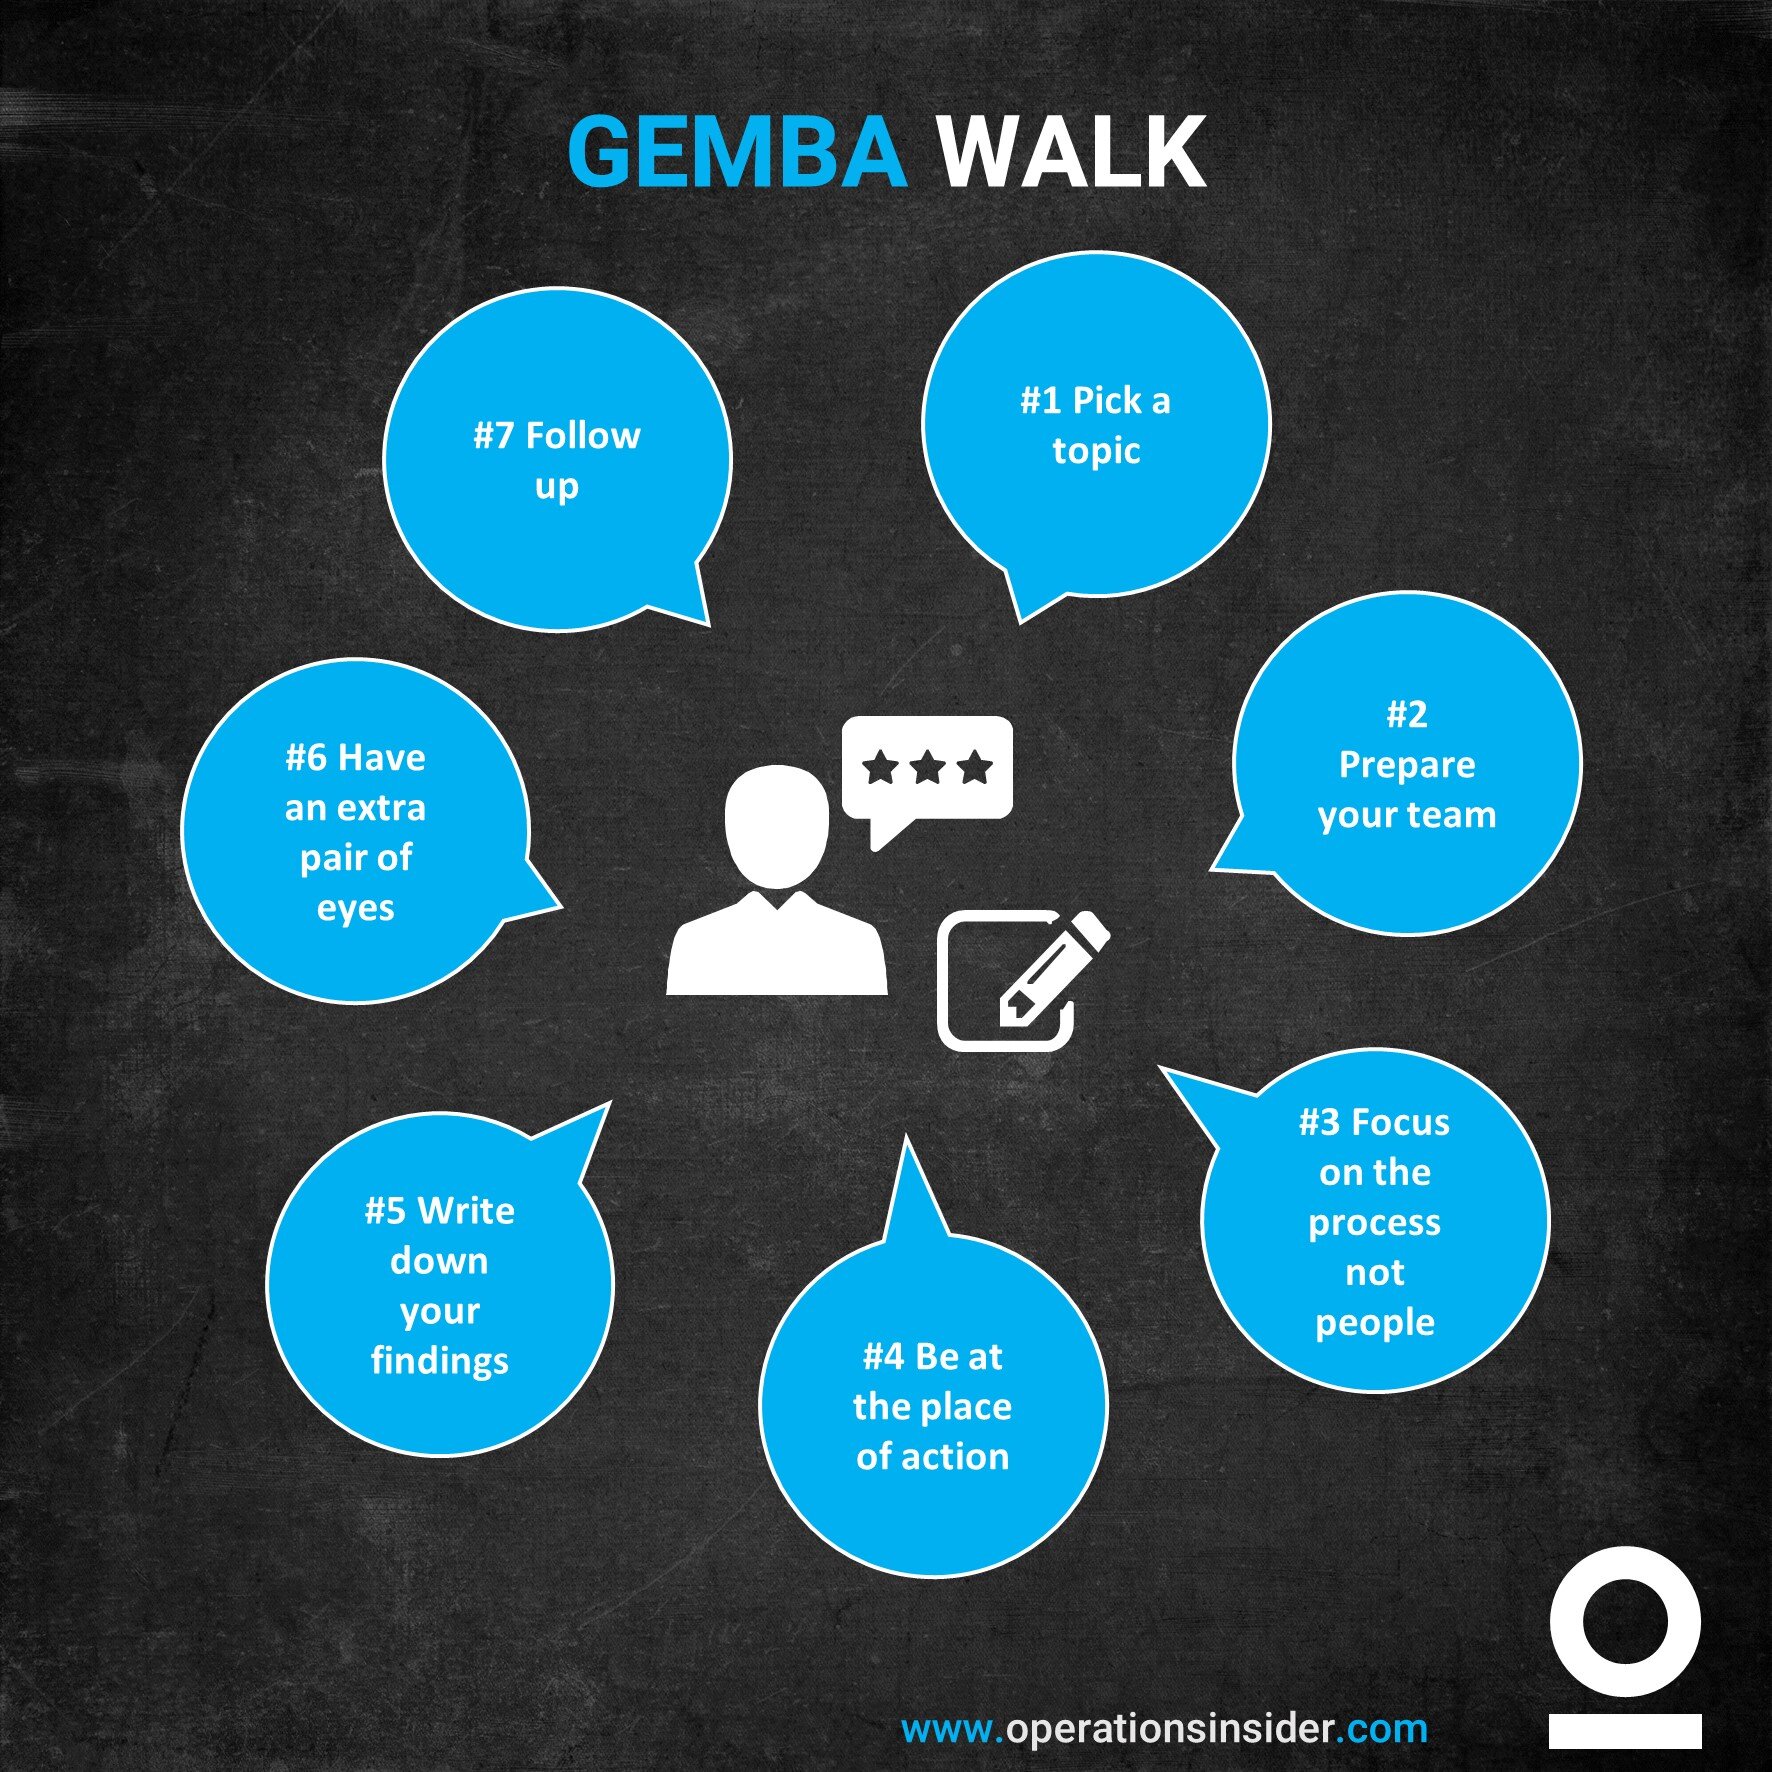
GEMBA WALK
Gemba - the Japanese Term for “the place where it actually happens”.
If you’re familiar with lean and you try to talk about it with others it is most of the time reduced on eliminating the 7 types of waste and people are feeling great when they know what TIMWOOD stands for. Don’t get me wrong it is great to have some knowledge and visibility out there but the downside is that it often leads to a quick end on taking action.
The key of lean is to fulfill the customer’s expectations and not reduce overproduction or WIP and all this by solving specific operational problems. The 7 kinds of waste are only the visible downside of weak or bad processes. They are only the symptoms but not the root cause.
This is always the tricky part in lean management. While it is mostly easy to identify waste it gets harder on seeing the root cause of waste in the process.
Lean is about learning to see!
Affiliate Ad

Learning to see is a lean must have and you can call it a real classic in the lean world. This is the holy book of value stream mapping. With value stream mapping you are very fast on describing a process and find out where MUDA appears and how to eliminate it. With VSM you have a great tool to show your given process, analyze it, smooth it out and test some options, before you even touch machinery or equipment. It gives you a blue print of your future process.”
Read more in our reading picks here.
But let’s get to the Gemba Walk Trail
To get used to standardized problem solving in the first step is to go to the place of action. You can discuss problems as much as you want but when you don’t get yourself to see it, it is worthless. This is where the Gemba Walk comes in the game. Gemba is a Japanese Term (well surprise in the lean world) and stands for the place where it actually happens. This can be everywhere and everything in the process chain, starting from typing in customer orders over work stations on the shop floor where you actually add value on something to the fulfillment process in your outbound warehouse.
Key of Gemba is not to talk in wild theories or totally abstract about problems, but to have a look where it occurs and discuss them on site (looking at the process in the real world, get rid of unnecessary power points and excel sheets! Nobody cares anyway!) Too often we want to believe the statement of a “pro” and forget about it instead of going there and have a look ourselves to gain a better understanding of the problem and make up our own opinion.
But above the pure problem solving it is about continuous improvement and the never ending journey of learning.
The question that might raise now is: What do I have to look for?
For this more rhetorical question are countless answers. Just google Gemba in the WWW and you will find plenty of sources and recommendations on where to start and what to look for. Some points that are always included are:
What is our standard? What should be and what is?
Can the person doing the job explain me the standard?
What is the person doing and what is he/she doing deviating from the standard to make it easier?
Why do have a deviation?
Do we need more material in the process?
Do we need less machinery in the process?
Can we do it with less resources?
Are there waiting times?
Do we have defective parts coming in or out the process?
Are we producing defective goods?
How can we identify defects?
Are all documents up to date?
What indicators are used/observed and how are they visualized?
And so on…
As you can see, there is a countless number of questions you can ask yourself and your employees during a Gemba Walk. Each of these questions is correct, important and have a right to be asked. But don’t even think about creating an audit checklist and ask always the same.
To bring it together
Stop thinking upfront what you want to achieve with a Gemba Walk, like improving a specified process, think about Gemba Walks in first place to gain a better understanding of the process flow and start from there making your way down to the root cause of problems in the process. As already mentioned this narrows it down to three simple questions:
What should happen?
What is happening?
Explain why!
Finally – use the chance during Gemba Walks and try to find improvements for visualization at the process. Even if you are not conducting a Gemba Walk – when you’re passing by and clearly see that something is wrong you have the chance to go straight in.
In the end it is all about time and we all know time is money.

5S
The 5S Method is a five-level system for the provision of safety, cleanliness and orderliness on the workplace.
The 5S Method is a five-level system for the provision of safety, cleanliness and orderliness at the workplace. The term „5S“ is coming from 5 Japanese words that begin with the letter „S“.
These 5 words describe the 5 principles for the organization of the workplace:
1S – SEIRI
Cleaning: Sorting-out and get rid of all unwanted objects.
2S – SEITON
Orderliness: Clean-up and proper arrange tools needed.
3S – SEISO
Cleanliness: Maintain cleanliness at the workplace and keep the standards established through 5S workshops.
4S – SEIKETSU
Standardization: Establishing work standards developed by 5S sessions.
5S – SHITSU
Discipline: Observing compliance of new work standards and drive for continuous improvement.
Why do we need 5S?
Goals of the 5S during the implementation:
Safety
Flexibility
Quality
Costs
Ergonomics
How can you implement 5S at your organization?

How to implement 5S
The 5 steps of the 5S-Method:
Sorting out all unnecessary objects at your workplace
All needed objects have to be arranged in a proper way
Keep your workplace clean
Standardize the steps 1 to 3
Keep your new standard or improve it even more
5S is a continuous process!

The 5S checklist
In order to maintain the 5S procedure and standard you should be implementing a routine of a so called 5S audit. The 5S audit is an instrument of sustainable implementation of the five step system for safety, cleanliness and order at your workplace.
Therefore 5S is relevant in all areas of your company, no matter if you are working in a office or your focus is on the shop floor. To maintain the 5S implementation and the ongoing improvement of all 5 steps. The audit can support you on identifying deviation and to improve.
So why do you need the 5S Method?
It supports you on
Reduction of uncleanliness and its causes in the company
Reduction of latent waste in the company (e.g. untidiness, unneeded objects)
Reduction of defective equipment and tooling
Reduction of deviations from standardized manufacturing procedures due to unnecessary objects and frequent searches for misplaced objects
Increasing the awareness of the employees about tidiness, cleanliness, waste and deviations from standardized manufacturing procedures
Enhancing the positive impression of the company towards the customer
So what are the goals when you implement 5S in your company?
1 Increase safety at the workplace
Everything lies in its right place and employees receive a standardized and up-to-date description of their workplace
The employees know where to find everything needed in the case of an emergency
Markings on the floor are used as a visual control aid to help the employees to stay clear of any dangerous situations
2 Increased capability to react
Expeditious reaction to the requests of the customer and expediting the manufacturing process
By involving all employees, the internal flow of communication is enhanced along with the identification and removal of mistakes
It supports the expeditious preparation of e.g. work procedures, replacement of tools, increased flexibility of the employees, streamlines the work processes, increases the general economy by making the work procedures more effective; and expedites the continuous process of enhancement
Mistakes and deviations from the standardized work procedures become an exception and can be quickly eliminated

This reading pick will show you the methodology as well as real doing and conducting of 5S Sessions. It is a great guidance and a step by step instruction with lots of advice and practical tools that will allow you to conduct your 5S project from A-Z.
Read more in our reading picks here.
3 Enhanced quality
The proper arrangement of material and equipment decreases the amount of defective products and improves the repeatability of the work process
Enables the employees to determine at first glance what is needed to do to ensure quality
Makes the problems more perceivable and thus enables their solution
4 Cost reduction
Shortens unnecessary searches and reduces the time needed to find objects
Shortening time for exchange of tools > SMED
Creating new areas
Eliminating all unnecessary objects
Too excessive or insufficient supplies are discovered and are made visible
Expedient realization of counter-measures
5S designates the 5 basic principles for creating a clean, well-arranged and effective workplace with competent employees – the basis is orderliness = 5S.
5 Developing a “Visual Workplace”
In the case of a visually created workplace the work procedures are adjusted to enable all employees to have the possibility to observe the actual work process
Visualization:
Organization of the workplace
Manufacturing process
Distractions, such as defective objects, sources of danger etc.
Production indicators (plan, overproduction, or as the case may be, underproduction)
How can a 5S Audit support you?
The 5S Method makes sure that each workplace, in the production or office, is organized according to the principles of cleanliness, orderliness and safety
To secure the permanence and the continuity of adherence to the defined 5S standards it is necessary to regularly conduct 5S Audits
For the different areas of Production or Administration and others, specific questionnaires are prepared, on basis of which the obvious deviations from the defined planned state can be detected
The 5S questionnaires are combined with a list of counter-measures necessary to rectify the situation along with the names of responsible persons
Stay Connected

Ad
We want information fast and in a nutshell. We from OI recommend Blinkist* - because it’s simply the best.
* = Affiliate Link