LANGUAGE OF LEAN

Production Diary
The production diary, as part of the shop floor management system, defines a shift based weekly forecast incl. upcoming tasks for mgmt., supporting functions and is openly displayed on the shop floor.
With the help of a production diary, based on a pre-defined shift planning all other functions and outcomes are planned and tracked. This includes the mgmt. team as well as all supporting functions. In order that everyone is aware about the upcoming week the production diary is openly displayed on the shop floor. With the production diary and the pre-set structure of daily meetings of the shop floor mgmt. all daily activities are carried out. Best known part is e.g. Gemba Walks and the included problem solving activities e.g. A3 or just confirming that all processes run as planned.
With this big part of shop floor mgmt. it is clear that all regular meetings planned along the production diary are set. All other unplanned activities or extra meetings need to be conducted respecting the fixed schedule of the production diary.

Hanedashi
Is a device or means for automatized unload of a work item from one process or operation, providing the correct state for the next item to be loaded.
Hanedashi is called a device or means for automatized unload of a work item from one process or operation, providing the correct state for the next item to be loaded. The Hanedashi principle of automatized unloading and orientation for the next process is often used in automated production systems that operate according to the Chaku-Chaku principle.
When designing a machine according to the Hanedashi Principle, the only manual operation is to insert the workpiece. The processing and afterwards the ejection is fully automated, the workpiece than can be transported to the next machine or handed over to the next operator. Meanwhile, the machine automatically returns to the initial position where it can be reloaded.
The conclusion of the Hanedashi Principle: Humans are better for loading and machines are better for unloading. It is that simple to knock it down.

7 Steps - Problem Solving
The 7Steps problem solving is a standard analysis method.
The 7 Steps problem solving is an analysis method that is typically used in the 0miles major customer complaints and warranty complaints: when risk analysis is necessary. The single steps are as follows:
Problem description / risks on similar products and processes
Define containment actions
Data collection (grasping the facts / failure mode analysis)
Identify possible Root Causes
Implement corrective actions
Evaluate effectiveness (Tracking Chart)
Lessons Learned
Root Cause Analysis is one of the crucial and basic requirements in a quality system for continuous improvement. Its target is to recognize a deviation and its origins, resolve the issue so that it is not recurring and improve the quality of the product or processes. Root Cause Analysis always depends on time if you observe a deviation start asap your RCA-activities as no problem should be allowed to grow.
To gain a better understanding let us describe the 7 Steps in more details
1 Problem Description:
Capturing the deviation - Ask the following questions:
What is the problem? (symptom; use illustrations to describe as clear as possible)
Why is it a problem? (content of complaint / definition of problem statement)
Where was it detected? (location of occurrence/Area of the product or process)
When was it detected?
Who detected it?
How was it detected?
How many defective / suspect parts?
Can the problem appear on other products or processes?
Other parts
Generic parts
Opposite hand
2 Define containment actions:
Use a Tracking Chart to list your counter measures
Track how many defective parts have been detected
List in Pareto format what kind of failures have been detected
Put in containment actions and responsible person
Define when the actions have been planned and implemented
Data collection (grasping the facts / failure mode analysis) get and check the valid documentation:
1st part release
Maintenance records
Poka Yoke checks
Process parameters tracking charts
Work Instructions (SOI)
Control Plan
Drawings
Production information
Error collection sheet
First Time Through Report
Boundary sample
Ok part available
Ask the following questions:
Was it the correct process? - How should it be?
Was it the correct tool/fixture?
Was it the correct part?
Has something changed in the process?
Has something changed in the product design?
Is the process in control?
Do all product components meet quality requirements?
Collect pictures, evidences and records to support analysis.
3 Build the ISHIKAWA Diagram
List the problem to be studied in the "head of the fish".
Use an idea-generating technique (e.g., brainstorming) to identify the factors for non-conformance and non-detection within each category that may be affecting the problem and/or effect being studied.
Repeat this procedure with each factor under the category to produce sub-factors. Continue asking, "Why is this happening?" and put additional segments each factor and subsequently under each sub-factor.
Continue until you no longer get useful information
To learn more about the Ishikawa – read this article.
4 Identify the Root Cause
Analyze the results of the Ishikawa after team members agree that an adequate amount of information is provided for each major category. Do this by looking for those items that appear in more than one category. These become the “most likely causes".
For those items identified as the "most likely causes" the team should reach consensus on listing those items in priority order with the first item being the most “probable" cause. A useful method here is to allow each team member to allocate 3 points to their chosen root causes. The root cause with the most points can be taken for further analysis using 5 Why.
Once the most probable causes are drawn explain failure mechanism focusing on 2 aspects:
Cause of non-conformance
Cause of non-detection named
Use the 5 Why method for looking at the problem
5 Possible Actions
Create an action plan with countermeasures for non-conformance and non-detection to eliminate/minimize the effect
Do not forget about due dates and responsible persons (preferable only one person for one action)
6 Evaluate the effectiveness (Tracking Chart)
Put in permanent actions (+ responsibility) and make clear when the action has been planned, implemented and stopped. Track how many defect parts have been detected. After implementation of permanent actions remove containment measures only if there are no defects detected any more.
7 Lessons Learned
Visualize BEFORE and AFTER (KAIZEN REPORT)
Specify what needed to be documented (e.g. Standard Operating Instruction (SOI), etc.)
Grasp what you’ve learned (improvements in working and detection process)
Think about potential applicability in your organization (review similar design, equipment, components, processes, material or manufacturing processes).
Share what you have learned within your organization.
Some of the benefits of the Root Cause Analysis process are that you will identify which procedures will need to be changed, which documents describing those procedures will require modification and who will need to be trained or re-trained.
Finally, don’t forget that the root cause analysis process must lead to an effective corrective and preventive action plan. One without the other would mean that there is no certainty that the issue is solved and that the failure cannot reoccur.
If liked this article give it a thumbs up.

5 Why
The 5 Why methodology is a well known part of the root cause analysis. Key is to ask five times in the row – why?
The 5 Why methodology is a well known part of the root cause analysis. Key is to ask five times in the row – why? It is not the only way to determine the root cause(s) of problems. Just to mention that it usually comes together with an ISHIKAWA analysis. If you want to get deeper into problem solving including ISHIKAWA and 5Why we recommend you the article taking on the 7Steps approach.
The practice of asking why five times in a row whenever a problem occurs supports you on identifying root cause(s) and to determine effective counter measures that are developed through the process of 5Why. Then it is a simple part of PDCA to develop and implement effective measures.
To be able to steer a wide product portfolio, survive the competitive pressure and at the same time satisfying your customers with a high quality product at a reasonable price can be a tough game. Most of the time you don’t have enough time to run the complete product development cycle, do your validation and verification… The end of the story is that you start production because you need to deliver – which automatically leads to mistakes in running daily business. Therefore, the simple method of 5Why can be used to support, not only, your quality department to get faster to the bottom of problems.
The solution for a problem is not always easy, sometimes the root cause is hidden. Therefore the method is an important element of the root cause analysis. One tries to get to the root of the problem step by step with why questions, because one assumes that several causal connections interlock. The system is easy to explain, but there is a lot behind it. If you really take the time to ask the questions carefully and discuss them, the results are extremely profitable.
You should go through these steps of the 5-Why method. Describe your problem as detailed as possible. As more facts you have, you are faster on getting to the bottom of the problem.
What is the difficulty?
When did it first occur?
How often does it occur?
Is this failure randomly coming or reoccurring in a pattern?
Can you repeat the failure?
What is the effect of this failure?
and so on….
It is very important to get a fast idea of the situation on site. Take the Gemba Walk as great opportunity to talk to the people who are actually involved and to see it with your own eyes instead of guessing from your office.
Avoid making assumptions at this stage - you may draw the wrong conclusions.
Keep calm and try to understand the complete context first.
Understanding the context is where the 5-Why method comes in. Gradually ask why questions in order to get a feeling for the interrelationship of effects. This works for many areas of the company, in production, but also in your private life.
Example:
Problem: I miss all the fun part with my kids…
Why do I miss so much? - Because I’m not often at home.
Why am I not often at home? - Because of my position at work I have long working hours and business trips.
Why do I have long working hours and business trips? Because I can’t get my work done in 8 hours and bad in delegating work.
Why can I get my shit done in 8 hours and miss to delegate things? Because I’m sloppy in prioritizing and time management and don’t trust others.
Why can’t I prioritize my activities and don’t trust others? Because I don’t have the information needed to do so.
Reverse conclusion: If I’m not getting the necessary information in a certain amount of time in an acceptable quality I’m not able to steer my employees but also miss the time with my kids.
Sometimes 2 questions are necessary, sometimes 8 or even more to bring you to the “right” conclusion. But don’t give up half way.
Develop appropriate counter measures:
What contributes to solve the problem and who can implement which measures? How long will this take and what consequences will the implementation have?
First: I should try to have set timeframes with my kids which are holy and untouchable.
Second: I should define what information for me is necessary to run my company.
Third: According to the defined Information I train my employees what I need.
Fourth: I implement a clear systematic approach that I have all information latest at 11:00.
(DING DONG - Sounds familiar? BINGO — Shop Floor Management with a functioning meeting cascade.)
Keep the wheel spinning!
No matter what – before start implementing ad-hoc whatever you find best – take your time to identify what actions contribute to a real long term effect, what effects it will have on other areas, etc. Nothing worse than if you think you are doing something great but in reality you make it even worse.
The cycle of questions is often interrupted too early. The real cause is then not really eliminated and after some time there are repeated difficulties.
You can test it: If the reverse of your assumptions works, you are probably at the end of the causal chain.
As mentioned in the beginning another way is the ISHIKAWA diagram
Just keep in mind that not like with the ISHIKAWA the 5 Why only leads you to one cause for a problem. But as always in life there can be more than just one that leads to an effect. Therefore, the combination of 5Why and ISHIKAWA gives you the best approach to determine causes. It will allow you to represent several major and minor causes that can contribute to the solution.
Get the big picture with an ISHIKAWA drill it down with the 5Why.

Affinity Diagram
The affinity diagram helps you to organize a large number of ideas into logical categories and natural relations.
So you have a large number of ideas and need to organize them. The affinity diagram is the perfect fit to get the job done and to structure your ideas into their natural relationships. Basically the affinity diagram describes a structured outcome from a brainstorm session. You can use it to generate, organize and consolidate information related to a product or process, complex issues or different problems. After the brainstorming session you should group the ides according to their affinity or similarity. This idea creation method was created in the 1960s by Japanese anthropologist Jiro Kawakita.
When should you use an Affinity Diagram
The typical use of an Affinity Diagram is when you are confronted with many influences or ideas in a state of chaos. Sometimes a problem seems too large or just too complex to understand it at first sight. Or you simply want that the whole team has a common understanding of a topic.
Usually you are confronted with this situation:
After a brainstorming session
When analyzing open questionnaires, such as survey results
When collecting and organizing large sets of data
When trying to develop relationships between different ideas
Or trying to reduce input to a higher level of categories
Typical process of developing an Affinity Diagram
The Affinity Diagram process gives a group a direction to go beyond normal creative thinking and defines categories to get all thoughts in order. This technique opens the doors and shows relations in between the whole organization which is typically separated due to department silo thinking. The Affinity Diagram has no limits, so don’t be irritated if you have to deal from 20 up to 400 items after a session. It is a starting point not more not less.
Materials needed: Sticky notes or cards, marking pens, and for sure a large surface (wall, table, or floor). Brown paper is a good way to start.
Step 1:
The brainstorming
Write down all ideas on separate sticky notes or cards.
Spread the sticky notes or cards randomly all over the brown paper
Gather all participants around the brown paper after all notes are taken
Hint: Use big markers so it easy to read for everybody from distance. Make key statements on the notes don’t write an essay.
Step 2:
Try to sort all ideas that are related in some way and group them up
Try to find relations between these several ideas
Let the team sort ideas
Try to find 8-10 relation groups
Repeat until all ideas are grouped
It is fully reasonable that there might be an idea staying by itself or that team members will move an already grouped note again to another. If an idea belongs in two groups, make a second sticky note or card.
Hint: In this step it is crucial that there are chats going on, it has to be done in silence. Focus is on sorting and grouping ideas. Headlines are done afterwards! Not upfront!
Step 3:
Open discussion with your team.
Try to find common categories and define headlines for each group together with all team members. Discuss what you see or why members see an idea in a different category. If necessary, make changes and move ideas between categories. In the end, when all ideas are grouped in the consent of the whole team, define the headlines of each group. Try to find a catchy headline that describes the meaning of the category in short.
Hint: Cards with the headline should be in a different color than the rest and should be self explaining about the group.
Step 4:
If reasonable, try to define “mastergroups” of several “subgroups”.
Sort all ideas to their identified category by placing all ideas under the “headline card”.
Hint: The sorting is done by gut feeling, not with a scientific approach.

SIPOC
SIPOC can be used to clearly define process steps within a process chain.
SIPOC is a > Six Sigma tool that summarizes an entire process at the start of an improvement project. SIPOC can be used to clearly identify process steps within a process chain. A SIPOC diagram is only a snapshot of a process. Each of the letters in SIPOC represent the names of the columns in the table:
S – Supplier, I – Inputs, P – Process, O – Output, C – Customer.
The SIPOC method has its origins in Six-Sigma and is used there in the definition phase of a project. To have it summarized see the following Infographic:

By applying this method, it is possible to quickly gain an overview of all the main elements of a process to be examined, even before more in-depth details are worked out.
SIPOC is a very simple and at the same time very effective method that can also be used in various situations in the lean management context.
Possible applications of a SIPOC can be:
Starting a KAIZEN workshop in order to create a common basic understanding.
To achieve a quick overview (top level) for subsequent process optimization
Simple type of documentation for existing processes
Identification of important process participants (who must attend the KAIZEN workshop)
Definition of the process steps to be investigated within a process chain
How to use SIPOC:
The SIPOC method can be used in many different forms, such as Excel spreadsheets, handwritten tables on flip charts or brownpaper versions using cards or post-it notes.
The easiest way is to start by listing the process steps. No more than 5-7 process steps should be listed, since the SIPOC method is not about carrying out a detailed process analysis, but only about gaining a rough overview.
It often makes sense to note down on the process card those departments or persons who carry out the process for the respective process steps, so that it can be recognized immediately who is responsible for the process.
Input: which input factors are necessary to perform the process step? This could be material, information, machines or a service.
Supplier: who provides these input factors? Do they come from an external supplier or from an internal supplier - perhaps as the output of a previous process step in the process chain?
Output: what is produced as a result in the respective process step. These can be material things such as components, assemblies or finished products, or intangible things such as processed information in the form of a document - e.g. a static calculation or an order confirmation.
Customer: for whom the result was actually produced. Make a distinction between external and internal customers. If no customer is found for the output size, it must be checked whether the process step makes sense at all.

SMED
Single Minute Exchange of Die. A method of increasing the amount of productive time and to reduce the planned downtime to single digit minutes.
Single Minute Exchange of a Die
This series of techniques was invented by Shigeo Shingo to set-up manufacturing equipment in less than 10 minutes. Most of the time people think in one minute but is thought as single digit minutes.
So what is behind the set-up time reduction?
This method is driving to increase the net production time as much as possible by minimizing the needed time to change from one model to another. As far as you have two or more products running on your line or to simply exchange parts of your machine or equipment that regularly needs to be replaced. This is increasing the flexibility of your production and allows you to react on changes in demand more quickly.
When trying to reduce changeover tomes the typical goal is to reach less than 10 minutes. The short summary of SMED activities is to analyze each element of the changeover with the EMIPS method to see if it can be eliminated, modified or moved outside the process, integrated, tasks are parallelized or synchronized.

SMED
When looking at those three stages we can simplify it further for each stage:
Just ask yourself:
Separate:
Can this task, as currently performed, be done while the line is still running?
Convert:
Which process steps can be moved out of the changeover itself and be parallelized or completely taken out? How can you do it?
Synchronize:
How can the remaining tasks be synchronized so you need as little time as possible to complete the changeover?
I save you the story with the pit stop in formula 1 - just google it by yourself and you will find the evolution of pit stops. Quite interesting and still valuable.
So what are the benefits of SMED?
The first effect you will see on improvements of the OEE of your manufacturing facility. If this is important for you and you are numbers driven. In the end you will reduce downtimes and therefore manufacturing costs as your machines will have a greater net operating time.
With a long term perspective SMED will enable you to have smaller batch sizes, which will improve your possibilities to react faster on changes of customer demands and in addition your inventory (tied capital) and WIP (work in progress) will decrease.

KATA
The term Kata is borrowed from Japanese martial arts and describes a series of movements following the flow of a fight.
The term Kata is borrowed from Japanese martial arts and describes a series of movements (routines) following the flow of a fight. It can be seen as choreography without an enemy. Translated in operations we are talking about implementing routines to achieve continuous improvements. In the lean world the term KATA is well promoted by Mike Rother - therefore customer satisfaction and personal development is improved using improvement and mentoring routines.
The improvement routine consists of four steps
Determine a clear target state > vision statement
Determine the current state
Define the next target condition
Get into action following the PDCA methodology
The goal is to start building a habit of continuous improvement by the application of the principles of Kata. Following Mike Rother - The Kata Story Board demonstrates the basics of the Toyota Kata methodology. This means nothing less than taking step by step towards continuous improvements in your organization towards the targeted state.
Using the Kata methodology gives you the advantage of defining a clear structure and clarity to the improvement process itself. The guideline is clear and easy to adapt:
Remove emotions and options
Create small, fast and effective PDCA cycles
Stop the trial and error > deploy a clear approach with small steps
Build habits that sustainably support your long-term goals
Following the Story Board
With the help of the Kata methodology you will start to build up new habits through continuous training and practicing your routines. With new habits you will reach new skills that might change your own mindest on how to look at things when focusing on continuous improvements. Therefore Kata is a universal methodology that can be utilized in any field, it will not only help you in your professional life but can also be adapted in your private life.
See one example of a KATA Story board below. You can also download a free example here.
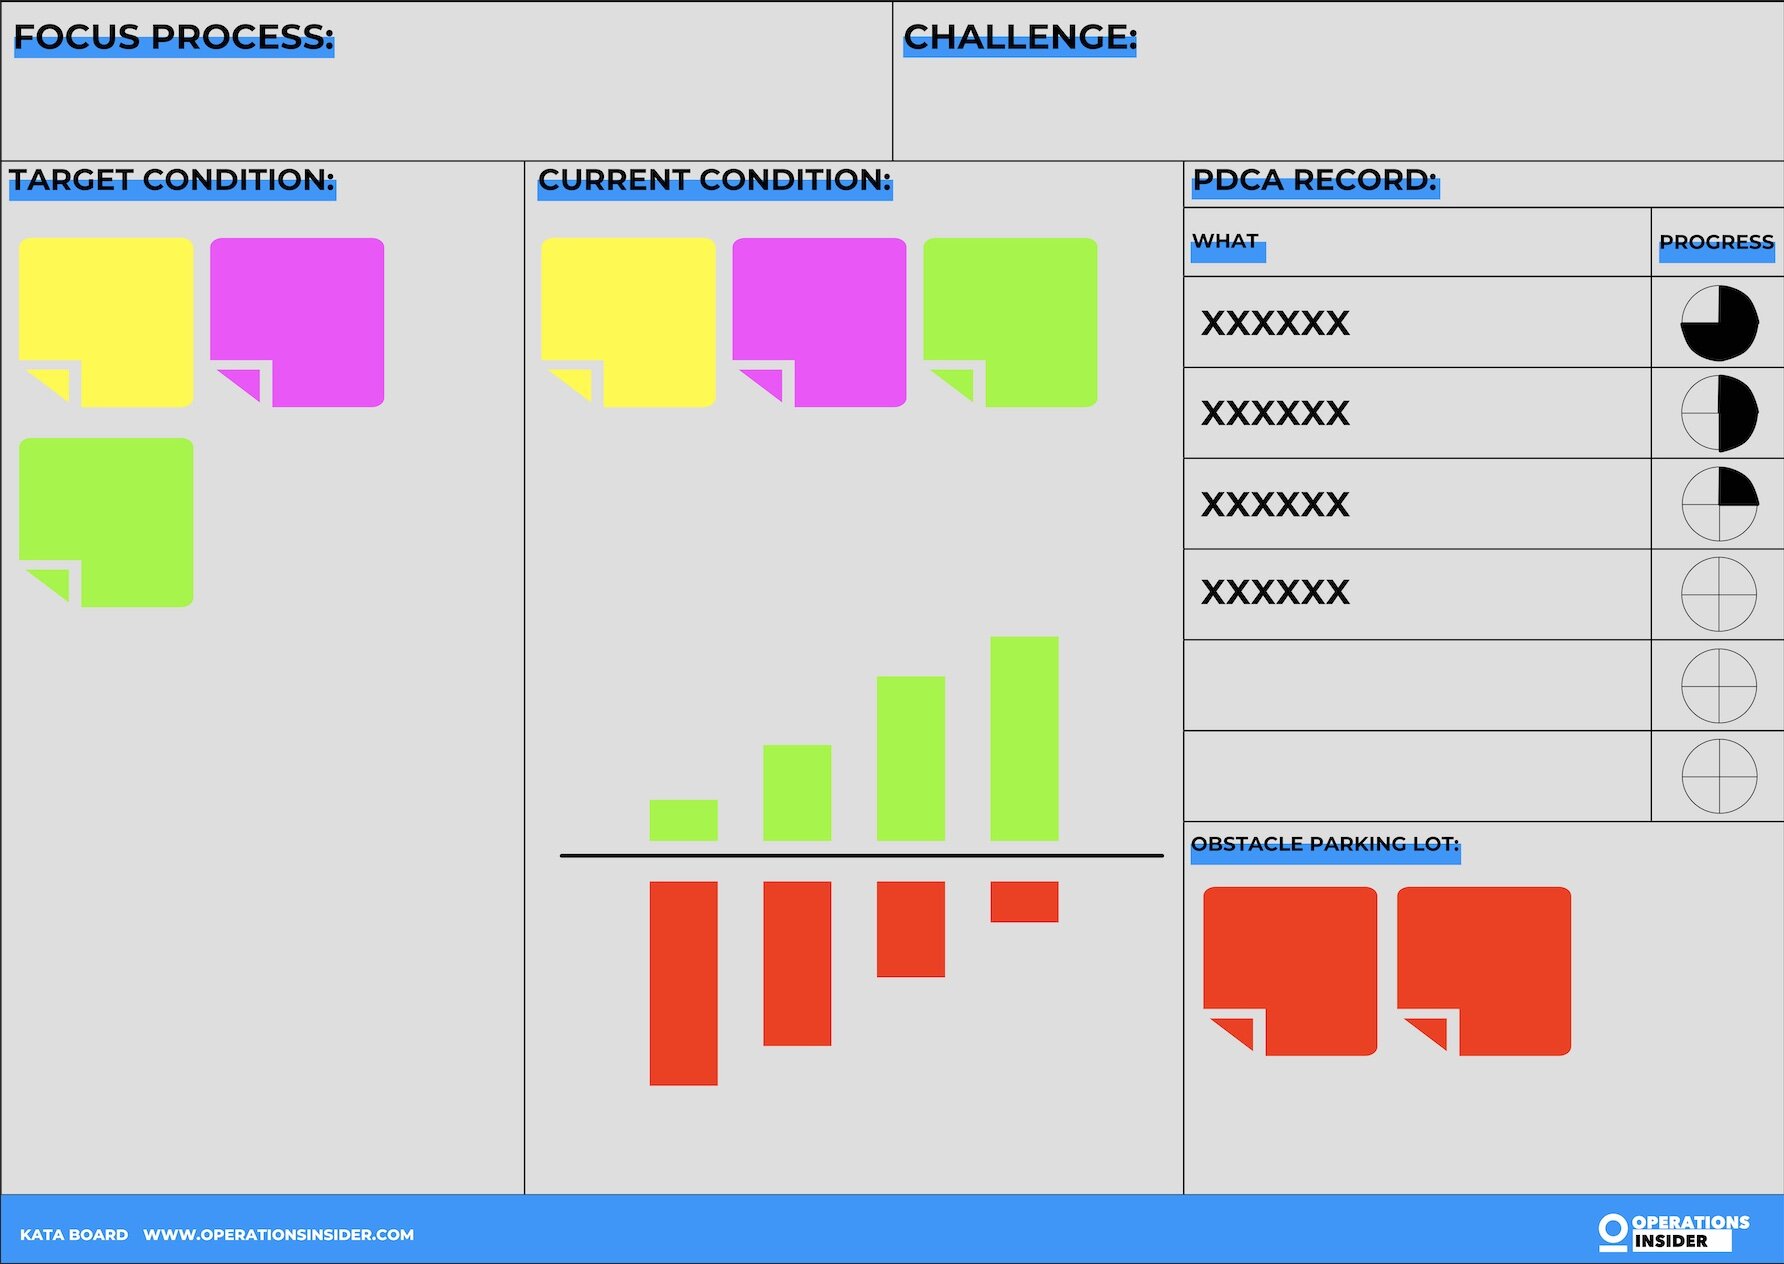
An effective way to introduce a lasting change is to establish the routine of continuous improvement habits that strive for excellence. For your organization that should mean to work with a KATA Coach who supports you by installing regular meetings (stand ups/huddles or however you want to call it) and go through the five questions of Coaching Kata and repetitively goes through the four steps of Improvement Kata.
Therefore the five questions of Coaching Kata are:
What is your targeted condition?
What is the actual condition?
What road blockers are in your way that prevent you or your organization from reaching your target condition?
What will you do/try next to come closer to your target condition?
What have you learned from previous steps?
Coaching Kata strives for a long lasting change and you can start small instead of creating a huge mountain to climb in first place. Coaching Kata is empowering everybody involved in your organization, from the shop floor up to the C-level. Kata enables people to participate and contribute to the organizations success through their own actions. In addition Kata will support you on your continuous improvement process and methodologies.
The Kata methodology can be seen as a toolkit helping you to gain a better understanding of how Kata can support you on:
Developing a standardized method on how to improve solution oriented processes
Training managers to see themselves as mentors, coaches and role models
Implementing a problem solving routine that supports on daily basis the continuous improvement process
Developing a framework for a living PDCA cycle that underlines the value of small steps to the all over defined target state
No matter what phase your in - whether you are a one person startup or multi-billion organization Kata provides a methodology that can be used to solve problems and brings you faster to the stage you want to be. The systematic approach can be implemented at all levels of CIP and all fields of industry.

PPM
The PPM rate (Defect Parts per Million) indicates how many NOT OK parts have occurred per million parts delivered or produced.
Parts per million or also known as Defect Parts per Million
The PPM rate (Defect Parts per Million) shows how many NOK parts have been produced or occurred with one million parts produced or delivered. Rates can be categorized into two main processes. Lower rate on processes where defects can be easily found and higher rate on processes where defects are mainly hidden, e.g. the structure on casted parts. The PPM rate is mainly used to determine the quality capability of deliveries of manufacturing goods.
Thinking about the automotive industry with the SOP (Start of Production) there are still many failures and defects in the process and those must be eliminated through continuous improvement (CIP) measures. In order to take the customer wishes into account, PPM rates are implemented as KPIs to see the progress of your actions concerning the reduction of those defects.
If you are dealing with the automotive industry you will find a lot of PPM regulations and they are often misused as a source of income. OEMs will give you penalties for exceeding the PPM rate, this is a very common approach. Small and mid-sized companies typically sign some sort of quality agreement with OEMs or their customer, Tier 3 up to Tier 1, this is sort of a framework for PPM rates for manufacturing processes throughout the complete value stream of production.
If you have your customer knocking at your door and asking for a PPM regulation, make sure to categorize your production into major fields of operation such as casting, molding, machining, etc. Or if you have dedicated manufacturing lines for your customer try to focus on the end of line quality check and agree on which ratio is acceptable and which not. Don’t go in the details, this will only give you a higher risk of screwing it up and a wider area of attack. And finally try to agree realistic PPM rates, nothing worse than promising something you already know you can’t achieve.
Just to make sure you got this, the way PPM will be evaluated depends on the criteria defined between you and your customers. E.g. agree on with how many non-conforming parts an entire delivery will be rejected.
Until know we looked on it as supplier, so let us change perspective and see it from customer point of view.
Supplier evaluation includes several performance measures in order to compare them and rank them properly. The PPM rate is the most meaningful evaluation to asses the quality among your suppliers. In addition to the PPM rate the number of complaints and costs per defect can be included as evaluation criteria. Specially in the automotive industry there are several rules and regulations but key is certification. You can make sure that your supplier follows several rules by being certified after standard norms, just think about EN ISO XXXX. Even when the certification process can be seen as complete waste of time and money, in the end you know that the suppliers know the rules of the game.
So what to do when the PPM rate is exceeding the agreed limit. First of all your quality management should step in. As customer I would ask for an 8D report, of course depending on the failure rate. Therefore again, agree what limits you will have and at what limit what actions will be necessary. It might also be that you will demand from your supplier to immediately conduct a sorting action.
What ever it is or you will work on make sure to follow a structured approach to successfully tackle the PPM rate. For this we recommend to read the PDCA article or the A3 article. No worries there is more that you can do but in the end problem solving in all the cases always follows the PDCA cycle.
The PPM rate is also a great example for a KPI that can measure the effect of your improvement or KAIZEN actions. You see it is a versatile KPI that effectively runs your business and shows you if you’re on track.

KANO Model
The Kano Model shows competitive advantage through knowledge. Therefore it shows the connection between product features and customer satisfaction.
The Kano Model shows competitive advantage through knowledge. Therefore it shows the connection between product features and customer satisfaction.
The Kano model structures and analysis the different types of customer requirements and sorts them into basic, performance and enthusiasm requirements. On the basis of this model, which is also known as the customer satisfaction model, products and services can be further developed which customers are more likely to pay for. The model is named after its inventor, the Japanese professor Noriaki Kano somewhen around 1980.
Thinking about our daily work, the Kano Model is quite interesting for product and service development but can also be used to give some guidance for planned product changes.
Typically when start working with the Kano Model a questionnaire is used to categorize the requirements. This questionnaire then determines which customer requirements should be taken into account for a product and to what extent.
The Kano Model recognizes that customer requirements have three different characteristics that make the purchase of a product more likely if they are met:
BASIC REQUIREMENTS
These are must have requirements by customers for a product or service. There are not highly considered and they alone are not the trigger for the purchase. But if these are missing the dissatisfaction is great. Old but still working example: you wouldn’t buy a car without windshield wipers or a cellphone without internet capability. It is expected to be there.
PERFORMANCE REQUIREMENTS
Requirements that are not taken for granted but are demanded. With a growing availability customer satisfaction grows with it. Performance requirements are defined by the customer, when we stick with the example of a car that means e.g. color, horse power, all wheel drive carplay etc. These are normal customer requirements that ensure higher quality of the product.
ENTHUSIASM REQUIREMENTS
The requirements are not expected by the customer but create enthusiasm when the are fulfilled. E.g. if you buy a new car in the area of the alps and you get free snow chains of a year of free car washes. As customer you do not expect this but you are thrilled when you get it. In other terms we are talking about going the extra mile.
In addition, with the Kano Model you find also those product or service features that are insignificant for customers satisfaction or are even leading to dissatisfaction and therefore rejection of the service or product. However, the absence of such characteristics does not have a positive effect.
What we learn from the Kano Model is that those enthusiastic characteristics become basic requirements over time. You can see this changes ongoing particularly in the technical industry such as car manufacturers and features of new cars, what comes now with the basic equipment was back in time all at extra cost.
The Kano model in practice
Following the Kano approach development teams should constantly keep an eye on the current basic requirements of their customers and try to fulfill on product developments new enthusiasm functions or features.
Customer requirements are typically identified through market research. With questionnaires customers have the chance to explicitly describe their expectations as well as what they don’t need.
Checklist: The Kano model at a glance
With the Kano systematic you are able to structure customer requirements into their characteristics
If basic characteristics are missing, dissatisfaction will occur and the product or service will not fly
Performance characteristics are showing if you understand what the customer wants and if you meet those characteristics the customer is satisfied
Enthusiasm characteristics are showing if you are willing to go the extra mile - long term customer loyalty will be the award
Over time characteristics will shift - so don’t make the mistake and rest on your success
If you want to find out more about the KANO Model I highly recommend Wills’ homepage and tool for KANO surveys. I share his love and believe like him that Kano model surveys should be easy to run. Find out more and visit KANOSURVEYS today.

Unpaid promotion - because it’s a great tool.

A3 Report
A3 Report and why it will help in the structure of the PDCA methodology.
The term A3 report comes simply from the size of paper which is used for the documentation of the report. The structure itself follows the PDCA methodology.
In the lean manufacturing world the best known use case of the A3 report is the problem solving report. In this case the responsible person from the quality department takes the A3 report, starts the problem solving actions and follows a systematic structure that makes it possible to describe the effects that are currently leading to a deviation from the standard. Using the A3 only makes sense when you don’t know the root cause yet. If you already know the root cause don’t waste your time. Fix it and go back to normal.

Schematic structure of an A3 report
Let us go through the different stages of an A3:
Describe the problem:
The A3 gives you the chance to initially describe the problem or symptoms - this can be done verbally or as a sketch. Don’t forget to mention when it was and under what circumstances. No matter what it must be easy to understand.
Keep in mind that the target in Lean Mgt. is always to train the people to improve their problem solving skills. Therefore if you are a quality representative try to coach the operators in this process or make a team work out of it.
The result of the description of the problem is the delta from the target state.
Root Cause Analysis:
Please be aware that your paper is only and A3 format. So either you go with an Ishikawa or a 5 Why. But not more. If you can’t conduct a root cause analysis with either on of these methods, the A3 is probably the wrong approach at all.
Counter Measures:
Following the PDCA plan your counter measures what you and your team or operators found out or might think have the most effect.
Lessons Learned:
Great you have done the job, you followed the PDCA and the root cause was found, defined measures helped and the problem is solved. No finalize the A3 report on where to find the documentation and what impact will it have on other operations as lessons learned.
When you are a quality representative using the A3 method ensure that the A3 report is also used for long term development of employees and quality standards.
With the help of the A3 report and a clear coaching through the quality department, all employees learn to recognize, evaluate and solve problems on their own. This is serving the general rule of continuous improvement (CIP)
Therefore the A3 systematic increases the problem solving competencies of your whole organization. And as already said, a problem is only the missing of an idea.
If you want to go deeper on the A3 report itself or the problem solving with the help of A3, we recommend our reading pick “Understanding A3 thinking” this book goes in the details and gives you great insights. Read our summary here. Or you can’t wait? Here is the link straight to the book:


MUDA
Read and learn about the 7 kinds of waste.
MUDA – Also see Timwood
In this article we want to talk about MUDA or the 7 kinds of waste known as TIMWOOD.
The seven kinds of waste have to be discovered and eliminated in daily operations. Therefore we will be looking at the 7 kinds of waste and learn how to use appropriate lean tools to reduce these non value-adding activities.
First of all use Gemba Walks to find out more about whats happening on the shop floor. Only through the on-site inspection you can see what is really going on. It is simply not possible to record the types of waste in the conference room at the green table. The CIP Kaizen action on site is always necessary to reduce waste.
When talking about production the ultimate goal is to increase value-creating activities in the complete organization and not to reduce them. Therefore non-value-adding activities are called MUDA - Japanese for wasteful.
Overview of the 7 kinds of waste and the lean approach to avoid these
The individual parts of muda are easily remembered with a simple mnemonic aid called TIMWOOD. TIMWOOD stands for the first letters of the several kinds of waste. Lets have a look at those and some hints what it means:
T = Transport
Material flow
Product-/Value-/Process orientation
Just in Time material supply of workstations
Pull steering of production with the Kanban principle
I = Inventory
Just in Time or Just in Sequence material supply
Pull steering of production with the Kanban principle
Takt time
Linking suppliers
Reduction of batch sizes or production lots
Implementation of One Piece Flow principle
M = Motion
6 S principle
Standardization
Fixed allocated spaces
Shortest ways
W = Waiting
Multi machining
Multi process handling
Material flow in U-shaped manufacturing lines
Implementation of SMED
Installation of Andon Boards
O = Overproduction
Leveling of manufacturing orders
Mixed-Model-Production
One-Piece-Flow
O = Overprocessing/-engineering
Processes are not necessary
Kaizen activities
Quality circle
Idea Management
Reduction of complexity
Reduction of components needed
Reduction of unnecessary process steps
Reduction of hand overs and quality loops
D = Defects
Reduction of scrap rate or rework
Internal customer supplier management
Self-inspection
Poka Yoke principle
Automation
Zero Defects principle
Stop the line authority
5S activities as part of the standard work
Visual Management and visual aids
S = Unutilized Staff
Idea Mgt.
Shop Floor Mgt.
Lean Innovation
Each of the individual elements of the 7 kinds of waste often interact with each other. If you think about your organization as a system, it is necessary to classify not only one characteristics. An approach can only be derived when several classifications of waste have been analyzed.
The 3 MUDA expressions
With the individual process sections and activities and the corresponding 7 kinds of waste, they can be divided into the following activities:
Value Adding Activities
Kanji Muda - Waste in terms of machinery and equipment
Hiragana Muda - Work that needs to be done in order to fulfill the task but not really add value
Katakana Muda - Everything not needed
All this combined is your total workflow
As seen in real life up to 75% of non-optimized processes are non-value-adding activities which means they are pure waste and eat up your resources. Therefore it always makes sense to eliminate each of the 7 kinds of waste in order to increase productivity. To get an idea see the following picture:

Katakana Muda (red - waste that can be eliminated immediately)
Waiting
Searching
Filling
Double work
Stacking of components
Kanji Muda (gray and yellow - waste based on machines and equipment)
Machinery movement without any function
Oversized machines that can produce more than the required parts during the cycle time
Hiragan muda (green - work that is necessary for the provision of services under the current conditions; value-adding process steps)
Return to starting position
Cleaning
Tightening
Manual operation of machines
So how to recognize and eliminate the 7 kinds of waste?
Muda can always only be detected at the place of action. Therefore Gemba Walks are the best way to go on the search. But one thing has to be clear - it does not have to be always big projects to reduce waste. Continuous Improvement is key - recurring CIP or Kaizen activities are very supportive to develop an eye for the 7 kinds of waste. Training makes masters.
Second - it doesn’t has to be expensive. Most actions can be implemented at low cost. E.g. make a spaghetti plot to visualize and recognize obvious unnecessary movements.
Third - always have an eye on the value-adding activities. With a trained eye from GEMBA WALKS you will have improved awareness of waste already in the planing phase of new processes. Use those lessons learned and avoid waste in the beginning.
We don’t want to go into details but there are two other types of losses that can be witnessed in an organization. Mura meaning deviation and muri meaning overload (man, machine, material equally). If you want to read more about these, have a look here.
Let us come to an end - even when it is hard, we could keep going on and on…
But some rules:
No excuses!
Be creative in first place - money always comes second
Never try to explain why something doesn't work, try how it works!
Adjustments kills your time and ambitions. Adjustment means to fight the symptoms not the root cause!
Do not worry about problems that do not yet exist.
Happy Improving!

Paradigm
A paradigm is a framework for thinking about something, usually a scientific or technical discipline.
Definition:
A Paradigm is a fundamental idea about reality, frequently unquestioned and difficult to change, that conditions all our thinking about and even our physical perceptions of the world or some aspect of experience.
Paradigm / Paradigm Shift
The framework of a paradigm is to think about something and can be considered as a technical or scientific discipline. Just think about the paradigm that big lot sizes are good concerning a machining process where the machine itself has long set up times, or that lean principles only effect the shop floor while having no influence on administrative tasks.
Paradigms are often considered as things that can’t be changed and therefore negatively determine the way we think about solving problems. Just think about automation of non value adding tasks > this is truly waste. So taking a wrong paradigm and building on them will reinforce the root cause of the problem itself and bring you no benefit.
Of course there are some paradigms that are right but do not hesitate to question and challenge them.
When talking about a shift of paradigm this means nothing more than changing the perspective of one frame to another. Changing the paradigm is a challenging process just think about for how many decades people where thinking the world is flat…

The 3 MU
Muda = waste, Muri = overload, Mura = imbalance. Read more about how to define and eliminate the 3 MUs.
In the lean world it is all about “WASTE ATTACK” > eliminate the 3 MUs. It is the bottom line of all KAIZEN and Lean activities. The 3 Mu come from the Japanese words muri, mura and muda. Muda is the most known as it describes waste and we discuss the 7 kinds of waste in the TIMWOOD article. Just to give you a hint TIMWOOD stand for: transport, inventory, motion, over production, over processing and defective parts. These kinds of waste are easily visible by observing manufacturing processes. It gets a little bit trickier if we talk about the other 2 Mu. Muda you get a straight forward feeling, mura and muri are more hidden.
The best way to explain muri is that you are over stressing a system or process. If you e.g. use a forklift that has a maximum of 500kg and you are transporting 1 ton. Your forklift won’t last long. You are either overstressing or trying to do something that can’t be done. The result of it will be a loss in performance.
Mura is unevenness or variation of processes most of the time a result from muri. You can also compare it in administrative work, if you have too little or too much to do. To stick with the example of the forklift, mura would be having only 200kg to load on the forklift on one transportation and on the next route 1.400kg. The result of this variation may be that you try to load 700kg on each route even this is exceeding the max load. The result of it will be that you have breakdowns, defects, excessive motion and other wastes. In all lean management, whether it is manufacturing, logistics, healthcare or knowledge transfer focuses on getting rid of muri, mura and muda in order to improve performance. If you want to get rid of waste in a sustainable way, you have to go upstream and start looking at how products, services or the work itself is designed. You need Value Designing and Value Engineering in the widest sense of the lean terms.
A simple and easy way to make things visible is the classic GEMBA walk – go to the production and see what crime your designers and engineers have committed. Go Gemba helps you to identify and eliminate wasteful steps in assembly and set preventive measures such as Poka Yoke devices to ensure conformity of your products. If we think of designing work itself we want to achieve a continuous and smooth stream of activities. Having this in mind always helps us to redesign processes, get rid of rework, delays or overengineered process steps. Value Stream Mapping as it is done today and redesigning it to focus on fast, high quality hands-off will result in reduced costs and time to market lead times.
MURI in terms of the designing phase will be visible in the need of long working hours to meet the schedule. You will see that it also comes from MURA because the workload itself is not levelled. Who hasn’t been in the situation that you have a design release and suddenly you are twice as busy as before. In the end MURI and MURA leads to MUDA when we start making failures under the pressure of time, when we start releasing before everything has been fully tested or checked.
In the designing phase or let’s say in the creative phase it is typically hard for employees to judge what is waste and what not. It starts with unclear requirements from the customer, but yes some work needs to be done anyway. That’s one point and another one is the mainstream mindset that design is 100% creative and can’t be standardized or quantified. We all heard about Pareto which tells as that 80% of a project are carry over parts and 20% are individual solutions for the specific project.
Lean Design is more a mental rather than a technical challenge.
Carrying on with the example of lean product development, the focus should be to streamline the routine and repetitive work packages so that there is more time for the individual, creative, value-adding part of the project. To clean out your process standardization of items, design elements, documentation, software used and the wiki of Lessons Learned from other projects are just some methods to apply basic lean principles in the development process.
If you think about decentralization of organizations with a global presence, design teams usually suffer from inefficient processes and inadequate design review meetings. Think about standardization as an organization wide language to communicate. If everybody talks the same language you have transparency which rewards you with more time for the creative part.
Considering the cost of delays in time to market, troubleshooting during launch phase and failure occurrence in the field, the design team should think about the rule of ten according costs of failure.
Lean management is based on continuous improvements (kaizen) based on standards and lean design is no different.
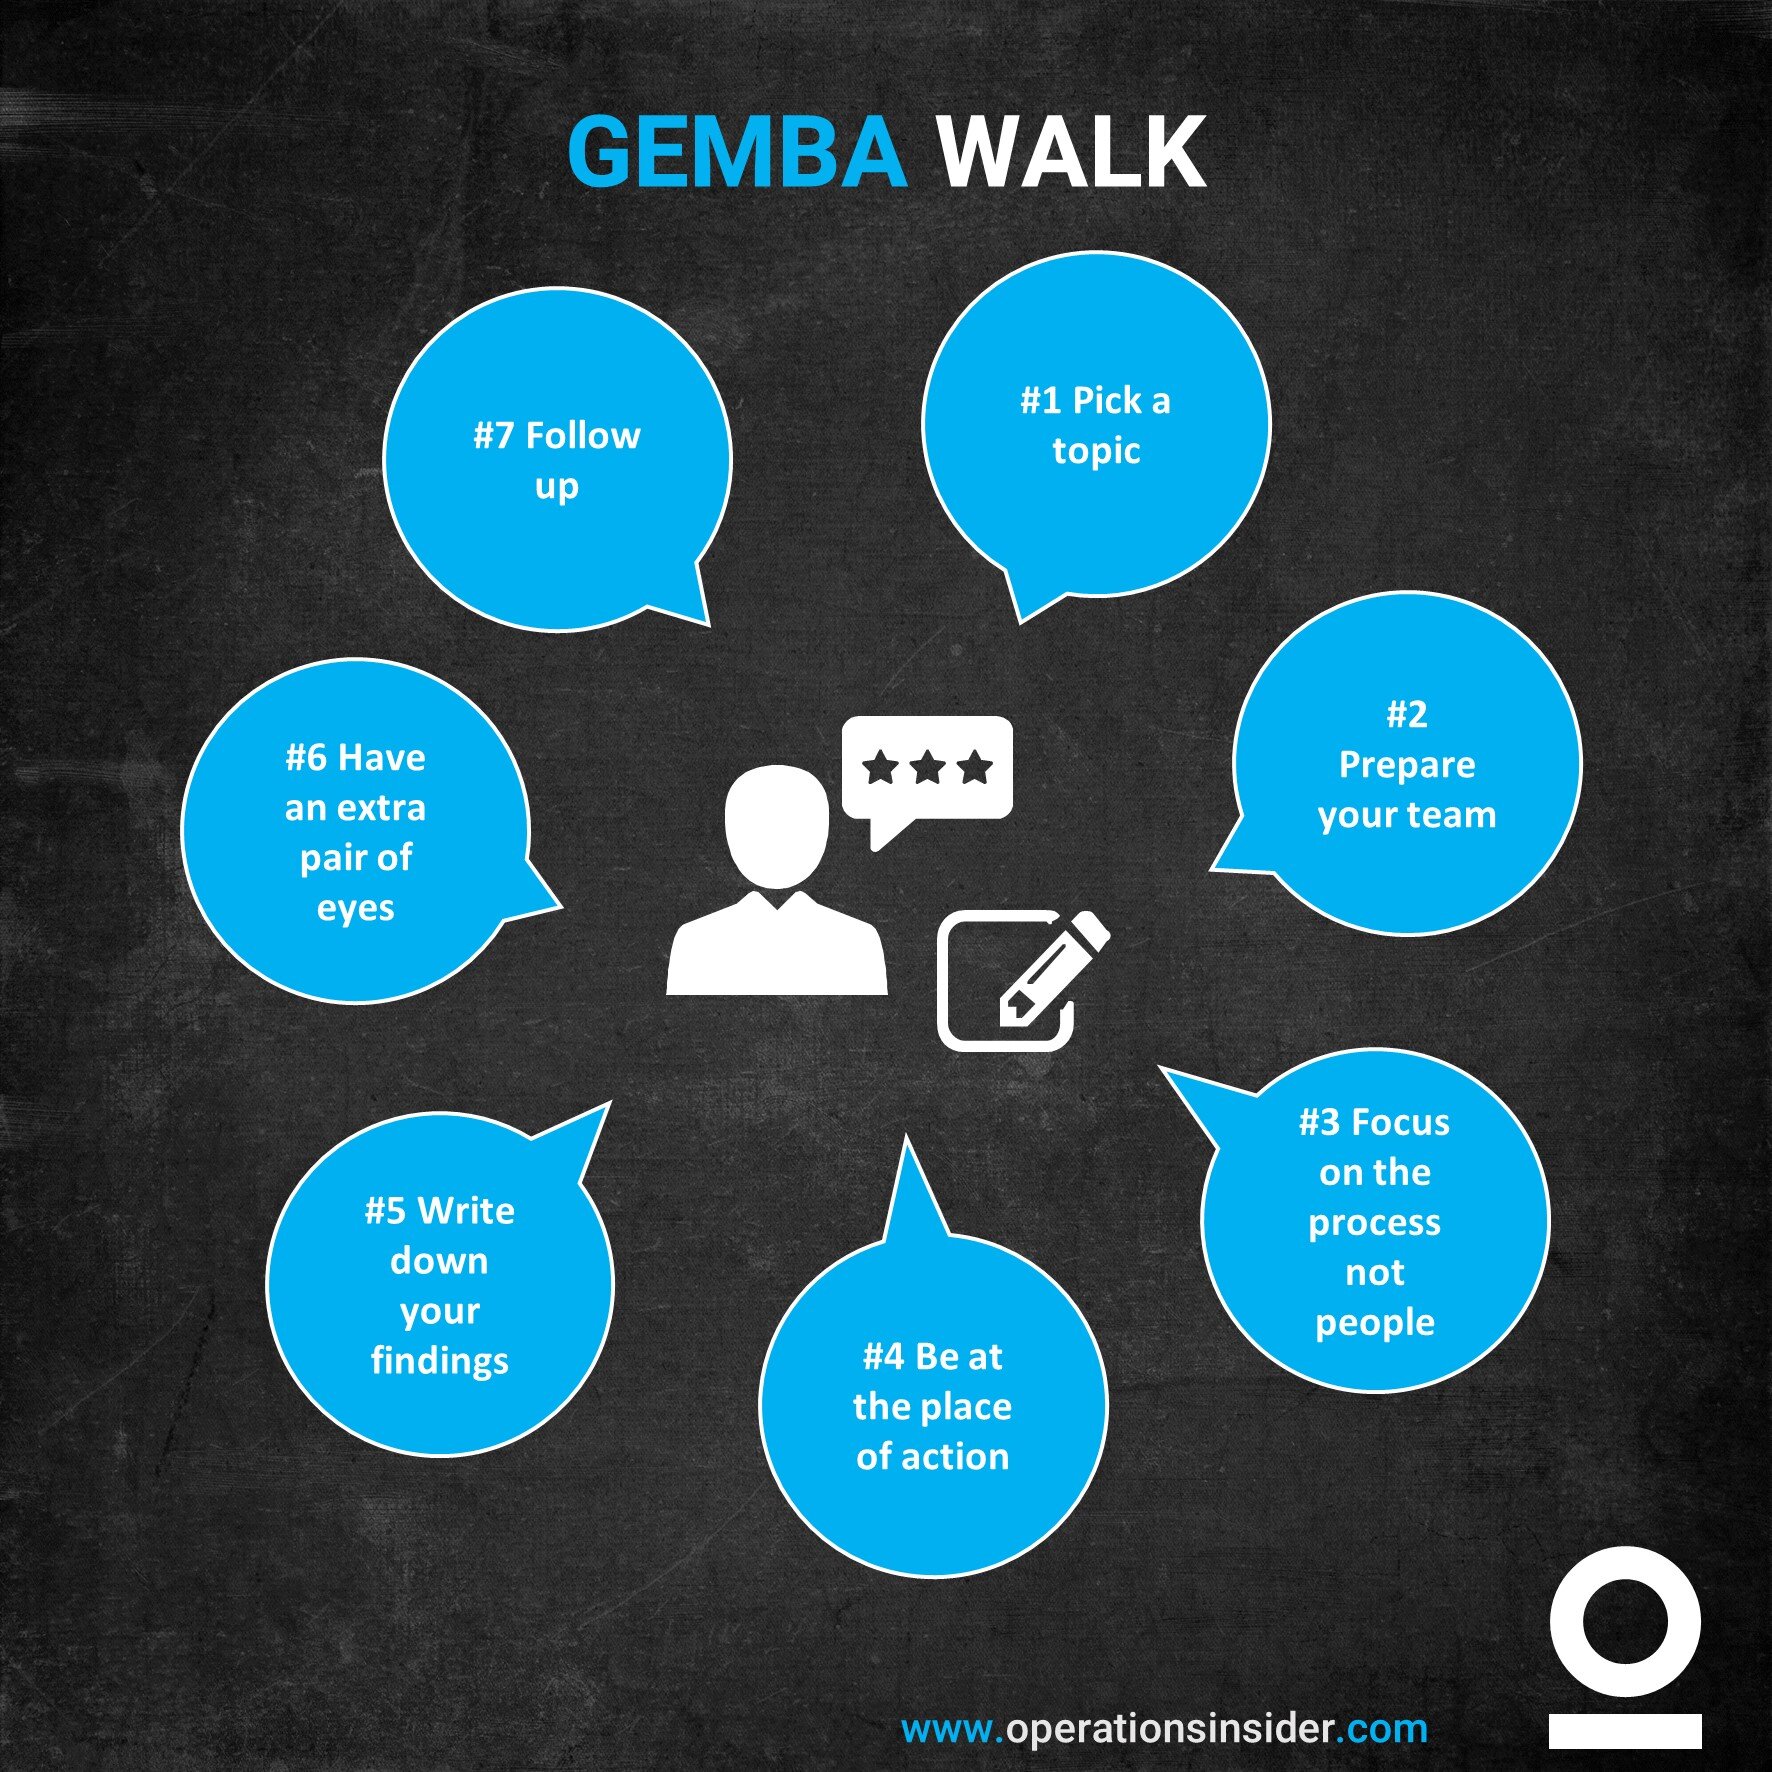
GEMBA WALK
Gemba - the Japanese Term for “the place where it actually happens”.
If you’re familiar with lean and you try to talk about it with others it is most of the time reduced on eliminating the 7 types of waste and people are feeling great when they know what TIMWOOD stands for. Don’t get me wrong it is great to have some knowledge and visibility out there but the downside is that it often leads to a quick end on taking action.
The key of lean is to fulfill the customer’s expectations and not reduce overproduction or WIP and all this by solving specific operational problems. The 7 kinds of waste are only the visible downside of weak or bad processes. They are only the symptoms but not the root cause.
This is always the tricky part in lean management. While it is mostly easy to identify waste it gets harder on seeing the root cause of waste in the process.
Lean is about learning to see!
Affiliate Ad

Learning to see is a lean must have and you can call it a real classic in the lean world. This is the holy book of value stream mapping. With value stream mapping you are very fast on describing a process and find out where MUDA appears and how to eliminate it. With VSM you have a great tool to show your given process, analyze it, smooth it out and test some options, before you even touch machinery or equipment. It gives you a blue print of your future process.”
Read more in our reading picks here.
But let’s get to the Gemba Walk Trail
To get used to standardized problem solving in the first step is to go to the place of action. You can discuss problems as much as you want but when you don’t get yourself to see it, it is worthless. This is where the Gemba Walk comes in the game. Gemba is a Japanese Term (well surprise in the lean world) and stands for the place where it actually happens. This can be everywhere and everything in the process chain, starting from typing in customer orders over work stations on the shop floor where you actually add value on something to the fulfillment process in your outbound warehouse.
Key of Gemba is not to talk in wild theories or totally abstract about problems, but to have a look where it occurs and discuss them on site (looking at the process in the real world, get rid of unnecessary power points and excel sheets! Nobody cares anyway!) Too often we want to believe the statement of a “pro” and forget about it instead of going there and have a look ourselves to gain a better understanding of the problem and make up our own opinion.
But above the pure problem solving it is about continuous improvement and the never ending journey of learning.
The question that might raise now is: What do I have to look for?
For this more rhetorical question are countless answers. Just google Gemba in the WWW and you will find plenty of sources and recommendations on where to start and what to look for. Some points that are always included are:
What is our standard? What should be and what is?
Can the person doing the job explain me the standard?
What is the person doing and what is he/she doing deviating from the standard to make it easier?
Why do have a deviation?
Do we need more material in the process?
Do we need less machinery in the process?
Can we do it with less resources?
Are there waiting times?
Do we have defective parts coming in or out the process?
Are we producing defective goods?
How can we identify defects?
Are all documents up to date?
What indicators are used/observed and how are they visualized?
And so on…
As you can see, there is a countless number of questions you can ask yourself and your employees during a Gemba Walk. Each of these questions is correct, important and have a right to be asked. But don’t even think about creating an audit checklist and ask always the same.
To bring it together
Stop thinking upfront what you want to achieve with a Gemba Walk, like improving a specified process, think about Gemba Walks in first place to gain a better understanding of the process flow and start from there making your way down to the root cause of problems in the process. As already mentioned this narrows it down to three simple questions:
What should happen?
What is happening?
Explain why!
Finally – use the chance during Gemba Walks and try to find improvements for visualization at the process. Even if you are not conducting a Gemba Walk – when you’re passing by and clearly see that something is wrong you have the chance to go straight in.
In the end it is all about time and we all know time is money.

6R
6R - The right product at, the right time, at the right place, in the right quantity, in the right quality and for the right price.
Let’s have a look on the logistics in operation. Everybody crossing the way with logistics will hear about the famous 6Rs the “six right ones” they say.
The right components
in the right amount
at the right place
in the right quality
at the right costs
at the right time
To summarize logistics this is it. The 6 Rs show that the main task of logistics is to make material/goods/components available.
You might have heard about the 7th R > the right customer.
So we think 6R are perfectly known as they got taught for decades. But with the lean transformation all over the 7th R becomes key on hitting lean mindset in logistics. It is all about customer centric orientation of the complete supply chain. It doesn’t matter where, how and why in the end you have to start with your customer and build along the upstream your logistics set up.
And here is the most valuable point, your customers are not only outside your organization, they are among your complete organization. If everyone along the process chain sees the next step as a customer, they also have to meet the customer expectations. This gives you a great pull effect throughout the complete process chain and in addition every employee is responsible as supplier and customer, two roles in one person. With this continuous focus on the customers demand or needs, all signs from the market result in a kind of resonance throughout your complete organization and causes an effect.
Logistics made up his way from simple material supply over optimizing material flow to become a crucial part of operations. Nowadays logistics are the arteries of manufacturing industries.
The traditional way to see logistics is seen in the 6R’s as shown in the beginning. For most of the business cases the 6R’s are enough and suitable in practice. But for real operational excellence and an impact on your lean journey keep always your customers in mind.
Following the 6(7)R’s will affect 4 main areas of your production system
Smoothed production
Warehouse organization
Production synchronous material flow
Cell production

Signal Kanaban
Kanban is perfect to steer production and prevent high amount of WIP.
Every container or bin in your production facility is marked with a so called Kanban card or signal. The time the last component is taken, the Kanban is send to the source it came in production and is added to the so called Kanban Board. This board actually shows you the amount of inventory you have in production. It is a great tool to minimize the risk of overproduction and can be used to steer your production facility. Besides this it helps you to have control of your inventories itself of course . Based on the design of Kanban Cards it is possible to identify directly where the container belongs to and in what interval you have to check on it.
The checking and supply of material or components lies in the hands of the mizusumashi.

Takt Time
The rate at which product must be turned out to satisfy market demand.
Takt Time is the beat of your process. When your process is perfectly balanced the complete workload and capacity throughout the complete value adding chain is best utilized to fulfill your customer demands.
So this is already it, the customer determines your Takt. Just have a look on your available net production time and divide it by the rate of the customers demand. I do the exact same thing, when I’m in the role of a project manager I want to optimize the available resources and straighten out the workflow over the expected time needed to finish the project. In the Lean World it is also important to understand the difference between Cycle, Lead and Takt Time if you are running a sophisticated Project or SIX Sigma initiative.
So let’s have a look at the differences
Lead Time VS Cycle Time
It happens very often that people mix up Cycle Time with Lead Time. Most common is the thinking that Cycle Time is the time needed between order placement and delivery while others think it is the pure time between two deliveries.
To put this straight, Cycle Time is the time from when the work is started until it is ended. This brings us to Lead Time.
Concerning Lead Time, it starts with the first contact from customer side e.g. the placement of an order and ends with the shipping.
Easy example:
Order placed by customer on July 12.
Order processed (actually fulfillment of order July 18-20.
Order shipped on July 20.
This gives you a Cycle Time of 3 days but a Lead Time of 8.
This exactly the point where value stream mapping comes into place and can help you on cutting down Lead and Cycle Time, but I will get you there in a different article.
Don’t get on the wrong path of thinking that Cycle Time is the pure value adding, it is simply the time you need for processing the order. That is the reason why should focus on Cycle Time when starting lean initiatives and make your way from there.
Takt Time
Yes it comes from Germany, TAKT comes from Taktzeit, meaning the rhythm of music. TAKT is therefore the beat of your process it is the measurement of your existing production. The Takt Time gives you the maximum amount of time to meet customer demands. In other words Takt Time is the heart beat of your customer and if you are not able to supply your customer in Takt you will bring your customer in struggle. Then you are very quickly no longer a supplier
So what is the Takt Time formula:
(Net Operation Time Available for Production)/(Customer’s Demand)
Always in the given unit of time.
Let’s make an example with the automotive industry:
Your OEM wants 1.000 cupholders per day. You have 8 hrs shift working two shifts per day. That gives you 16hrs per day. Then you deduct times for breaks, distribution time and for preventive maintenance measures, we assume 75mins per shift, this gives you:
16 * 60 = 960 minutes
960 - 150 (75*2 Shifts) = 810 minutes
810 minutes / 1.000 cupholders
= 0,81 minutes per cupholder
or in other words you have 48,6 seconds for one cupholder
Having a look on this calculation you still have to consider some factors, such as operations that are done simultaneously.
The tricky part with Takt Time is that it is based on the assumption that you have a continuous amount of demands coming in from day to day. With high fluctuations on demand you will have to readjust your Takt Time from time to time.
Takt Time is also used to calculated a couple of other parameters, such as batch size, work in progress, shifts needed or operators needed.
What to say in the end…
If you are trying to run KAIZEN actions or CIP measures the first thing to understand is what does Cycle, Lead and Takt Time stand for. Only with the right setting in the beginning your improvement efforts will show an effect.

Mizusumashi
A Mizusumashi is the operator responsible for supplying a workstation and keeping production going without interruption.
Water Spider or Mizusumashi
Mizusumashi or in other terms called Water Spider is the responsible employee of the inbound logistics for supplying workstations and keeping production going without interruption.
The Mizusumashi is someone who moves quickly and efficiently from station to station in order to collect and deliver material/components to the primary members of a flow cell. Through the Mizusumashi we try to move as much of the non value adding work away from the primary process steps as possible and is centralized to the water spider.
The Mizusumashi differs from a material handler in that the sequence of operations and the way the tasks are performed are specified. A water spider’s purpose is to handle the replenishment tasks so that the production personnel can focus on the value-added tasks that create products.
Always keep in mind that a Mizusumashi has a clearly standardized process. The rounds should always stay the same as well as the replenishment tasks. They collect the finished goods from the lines, drop Kanban Cards, refill Kanban Boxes and remove waste material. All of these tasks relieve the operators in the line and keep up the production flow.
For the best utilization of a Mizusumashi a proper setup is critical. For everyone involved on the shop floor you must have clear rules. This means clear location for bins, full and empty, clear visual controls that initiates the action of the Mizusumashi and strict following of 5S rules according to designated locations of components and goods
With the help of a Mizusumashi you have the chance to minimize variation and improve the production flow. Following the lean principles you don’t want to waste time and keep up working in sequence. The key is having a position that keeps the operator in place and let them do the job without interruption.
Of course with the role of a Water Spider there is some waste involved. Often they leave their designated route to check on stations without any sign of shortage. But nevertheless in the end the buffer range for all stations will go down, which means that the fixed capital on the shop floor will shrink.

U-Shape Layout
The U-shape layout describes the layout of machines and workstations in a one-piece-flow, where they are laid out in the shape of the letter “U”.
The U-shape layout describes the format of the manufacturing or assembly lines of machines and workstations following the principle of one-piece-flow which is laid out in the shape of the letter "U". The operators are working inside the "U" and with the proper supply of components or material allocation from the outside the movement is reduced to the minimum. The goal is also with the U-Shape layout to have interruption free assembly.
Using “U” Shaped Cells
Generally speaking the u-shaped layout of a manufacturing cell allows operators to easily move from one process step to the other as well as passing on parts or pre-assembled units to the following step with little effort. It is not a necessity to have the U-shaped configuration. This comes mostly from maximizing throughput on less manufacturing space (€/sqm).
The layout of assembly lines in a “U” shaped layout has several advantages:
The Start en End are close together, allowing with an installed 2 container mgt. to have full visual control. Following the mizusumashi principle - one operator can handle feeding the line including supply of raw material as well as the transport of finished goods.
The shortening of distances allows to share process steps, like in a chaku chaku* line, as well as reducing the wastes of transport and motion.
The U-shaped layout provides you the foundation for interruption free one-piece-flow.
Transparent and open communication within the work cell is easier.
Value adding process is done inside the assembly line, material supply is done from the outside.
Following the principles of flexible equipments - high level performance is when your machines and tables are on rollers to have a quick reconfiguration.
Typically as mentioned before:, it is less floor space required than with a stretched line, as well as distances for movement are reduced.
Chaku Chaku is a takt flow oriented manufacturing process model. It means load load and describes that one operator follows the complete assembly process - walks with the good - and conducts each assembly process. To learn more about Chaku Chaku read here.
Stay Connected

Ad
We want information fast and in a nutshell. We from OI recommend Blinkist* - because it’s simply the best.
* = Affiliate Link